What makes Nakisa Decision Intelligence different?
The Nakisa Decision Intelligence platform combines:
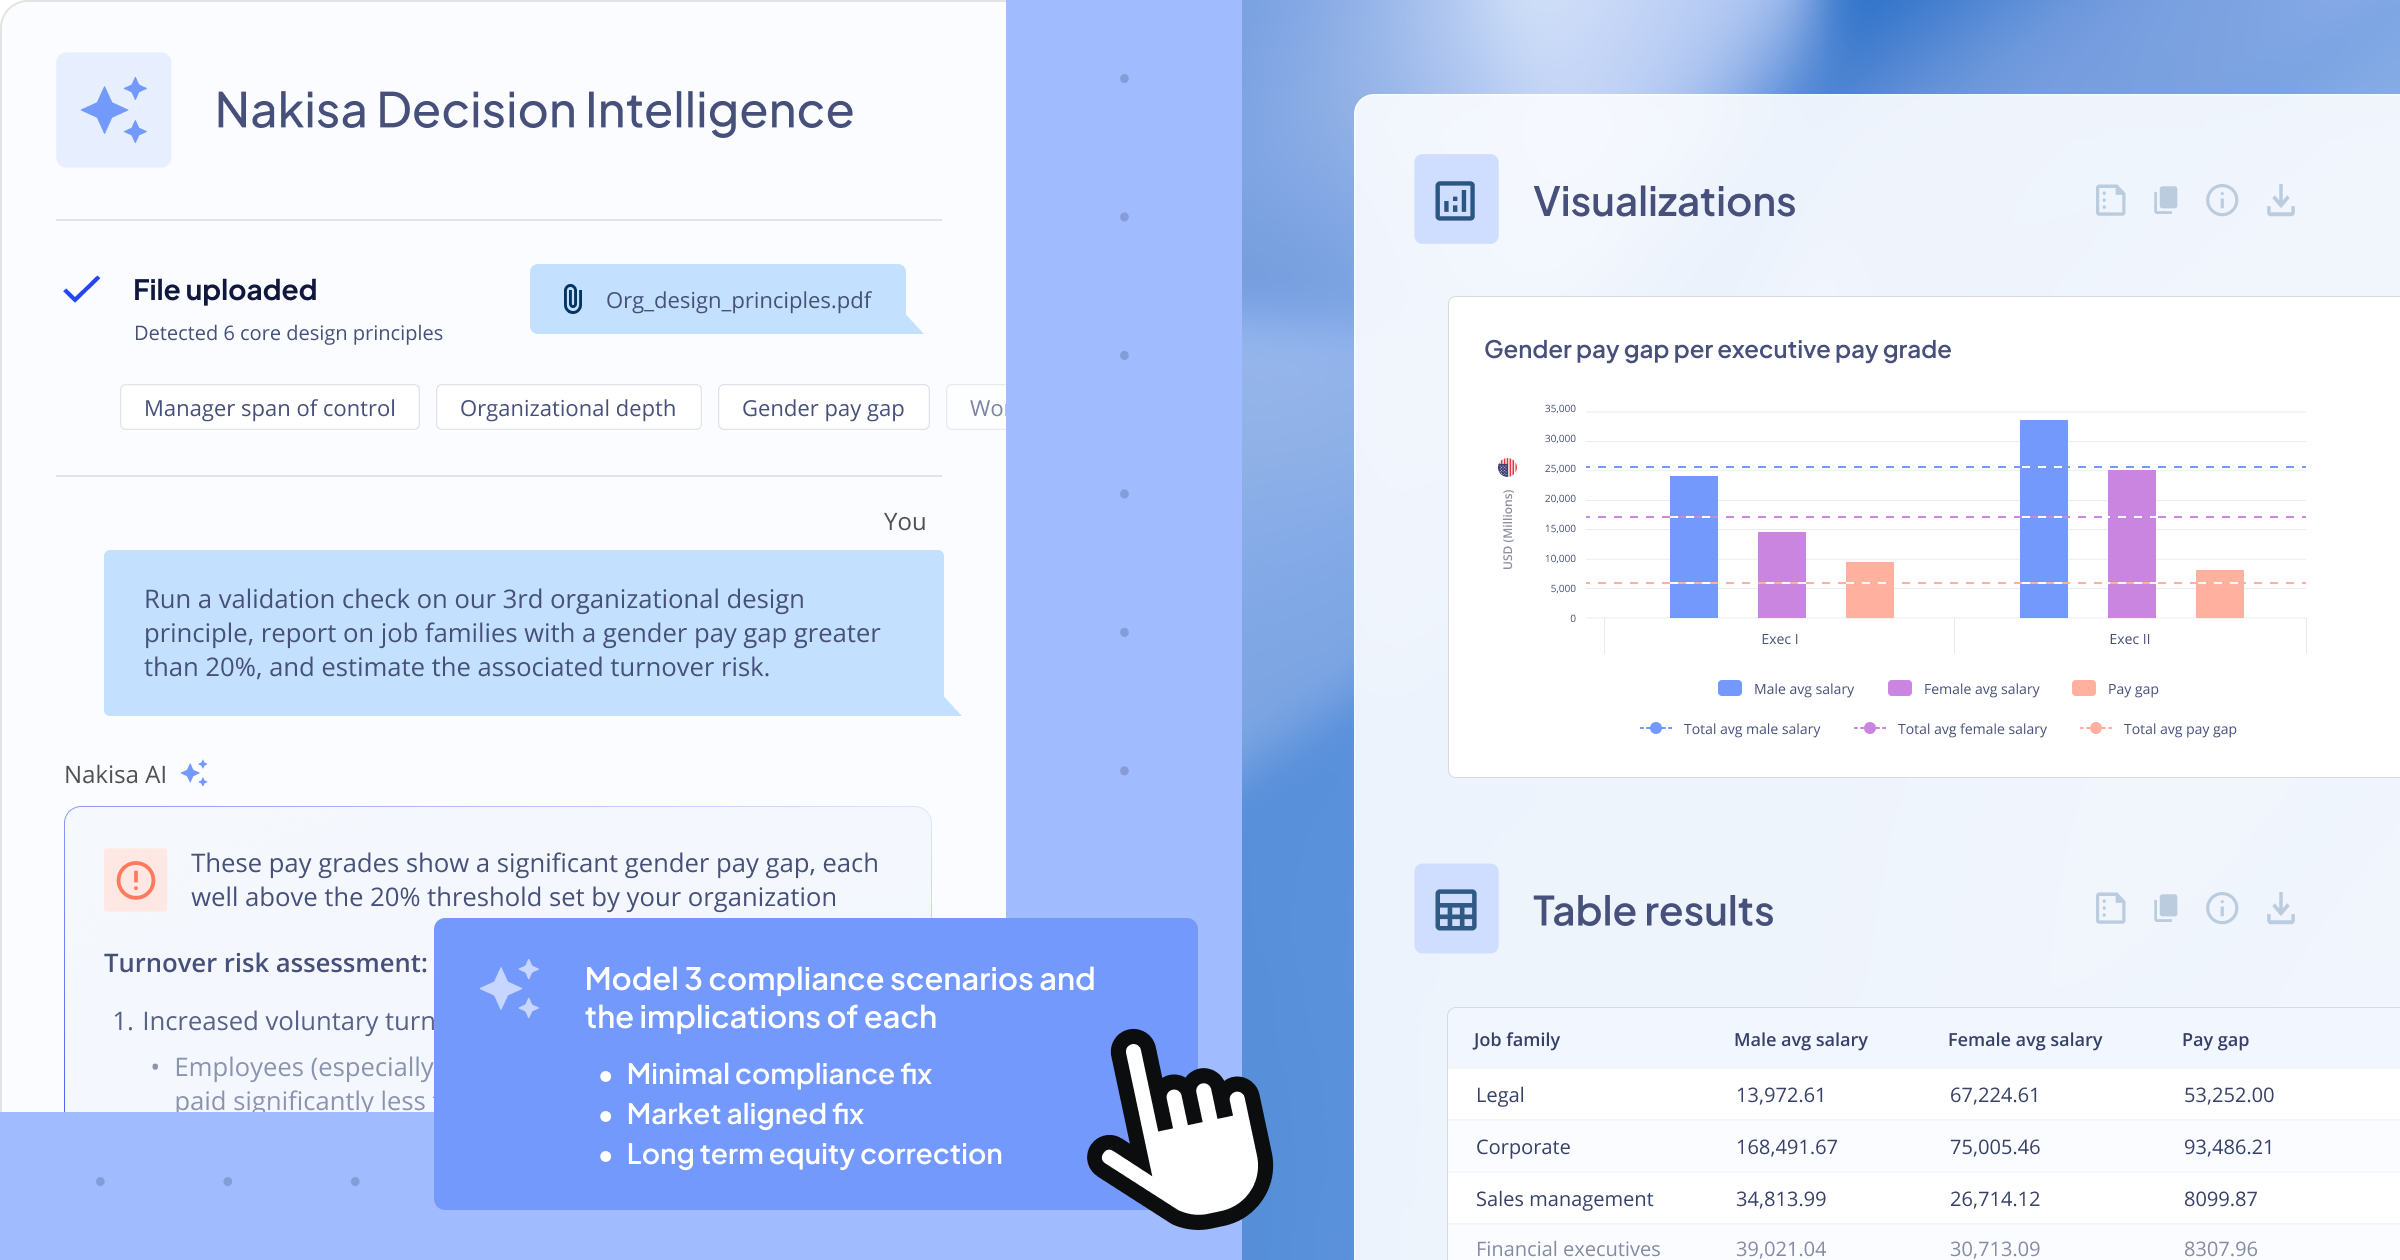
- Natural language querying - Ask NDI: “Show me all positions with invalid reporting lines” — and it builds the graph or table automatically.
- Real Org-Graph intelligence: NDI uses your real position hierarchy (solid + dotted lines) to detect structural issues.
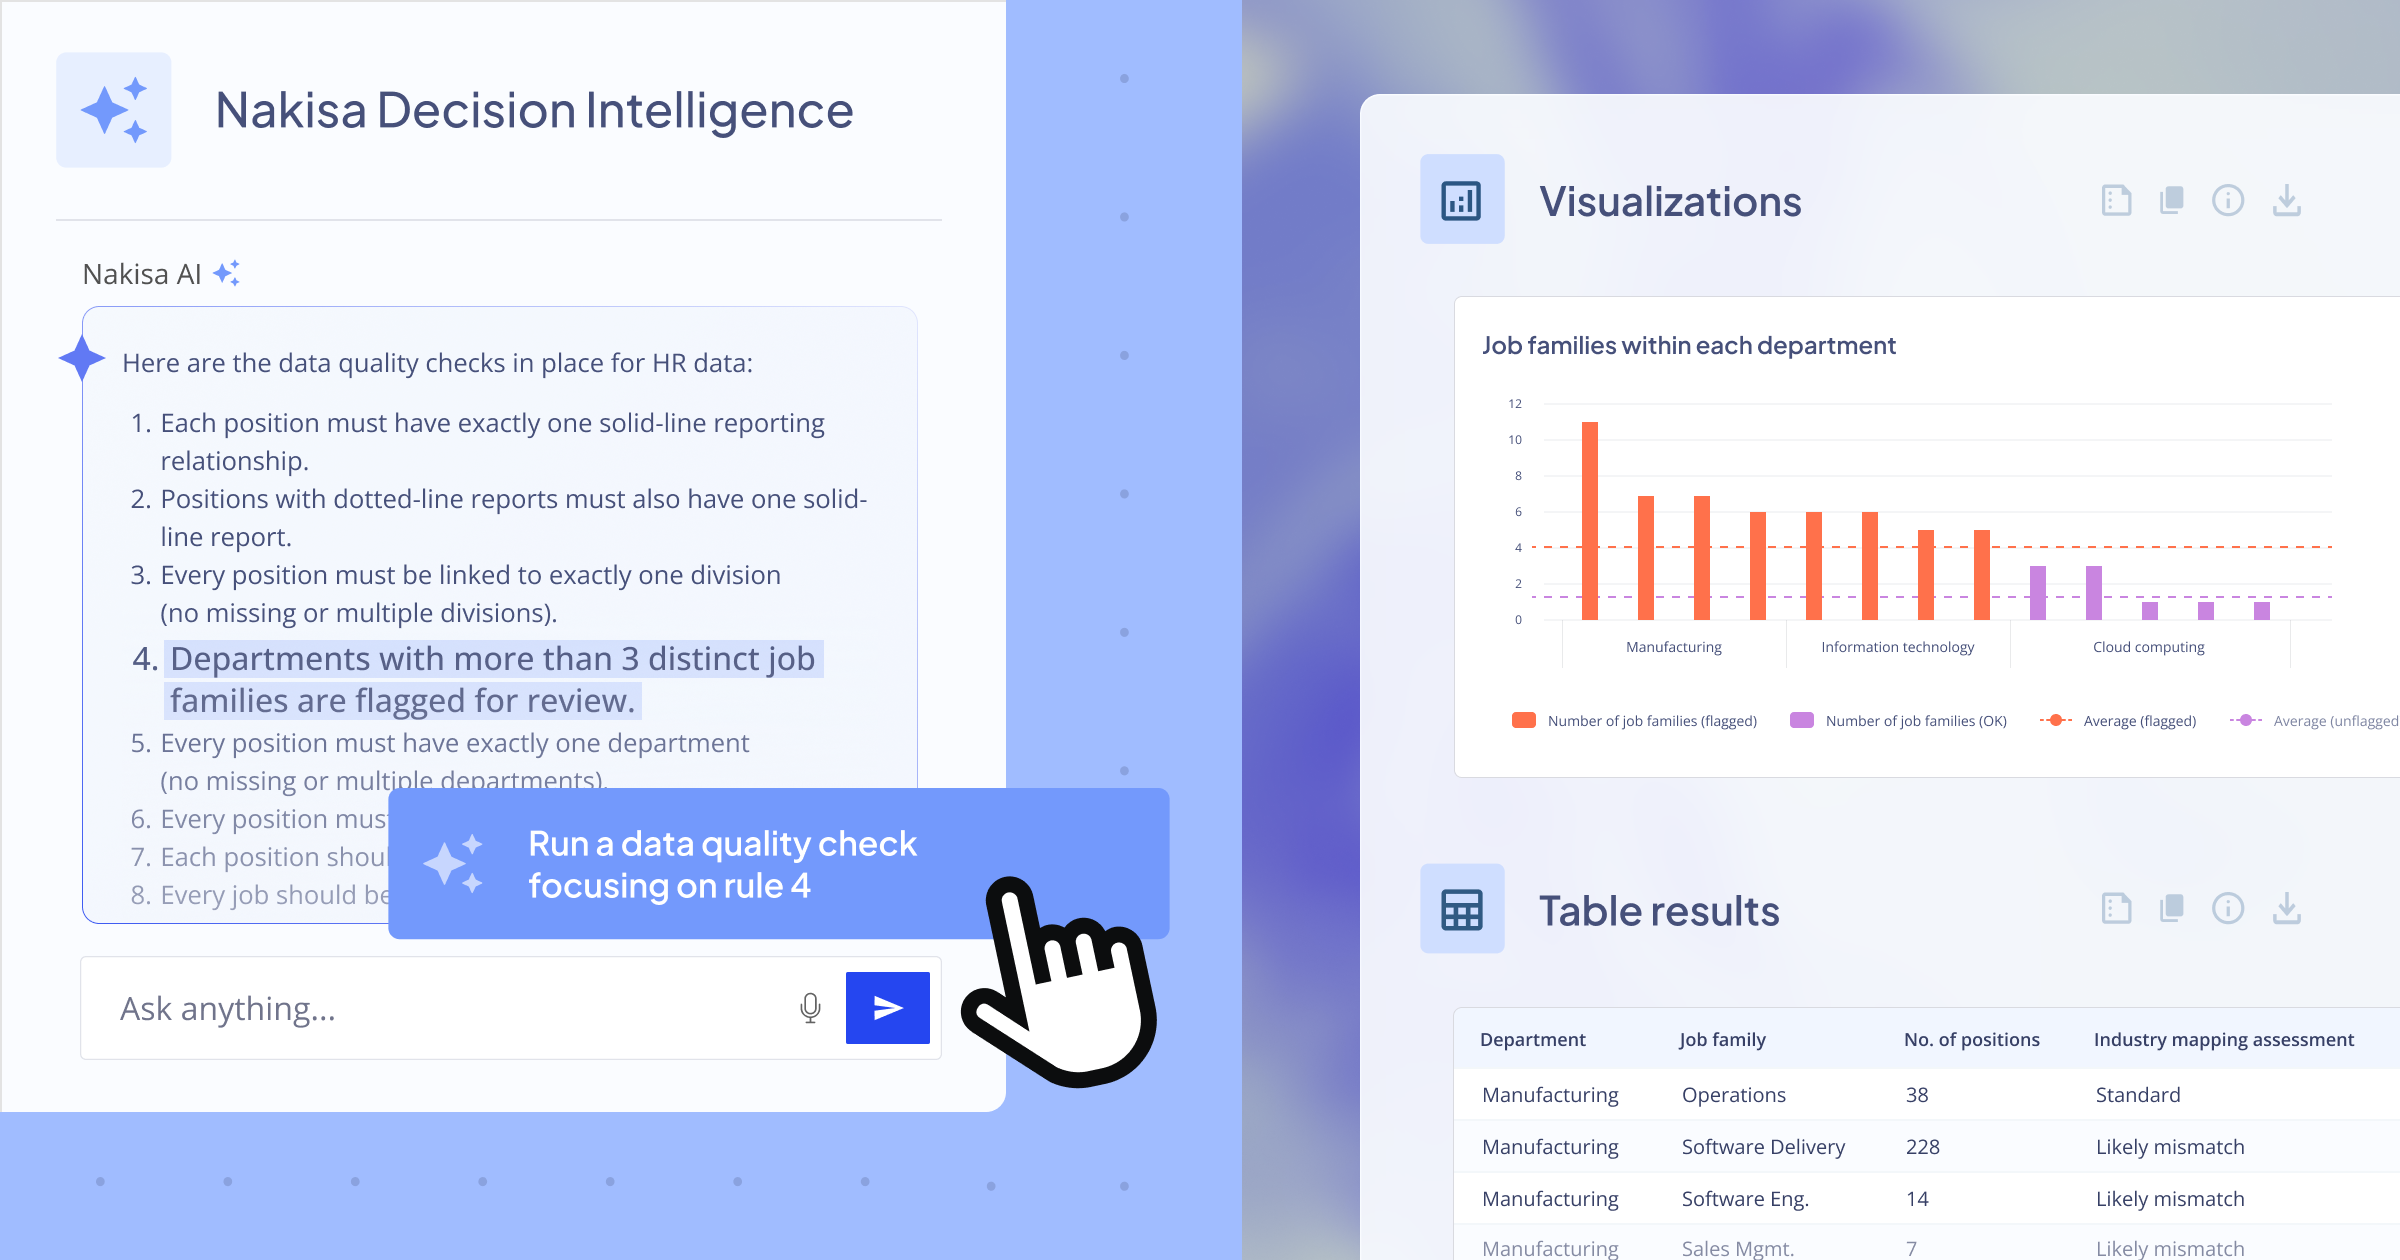
- AI-based data quality diagnostics: It automatically highlights missing managers, invalid job links, FTE inconsistencies, skill gaps, pay misalignment, demographic anomalies, and more.
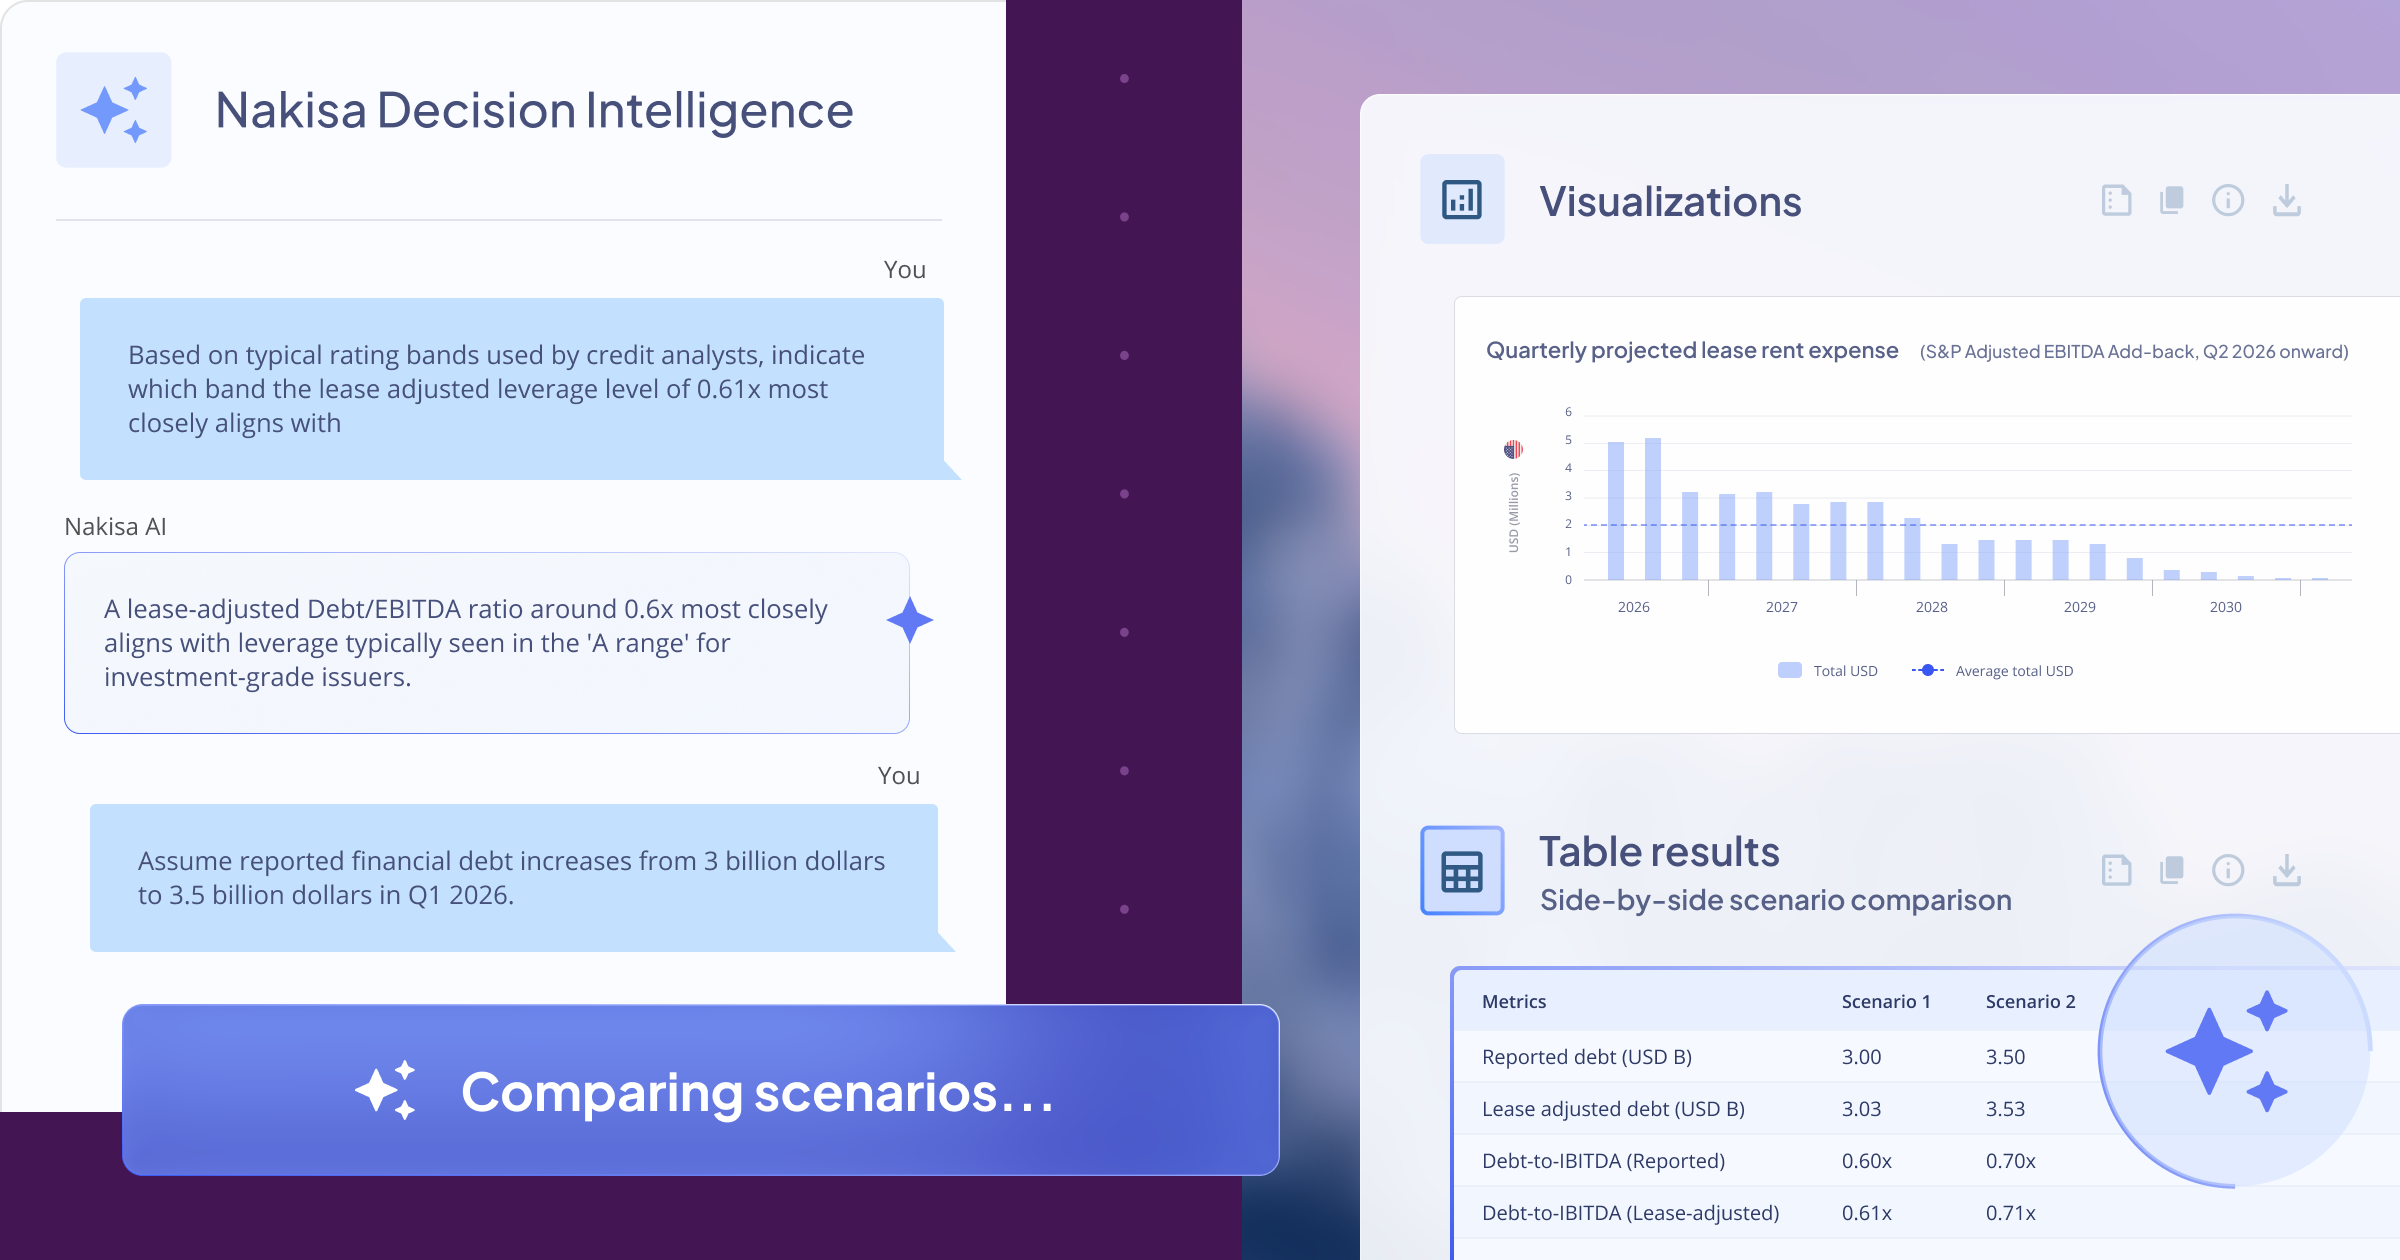
- Visual narratives: NDI doesn’t just give data, it provides explanations, charts, tables, and recommendations.
Here’s the best part: everything in this article can be executed directly on your HR demo data inside NDI. And because NDI also supports Real Estate, Finance, and Accounts Payable datasets, these data quality capabilities, along with domain-specific rule sets, extend seamlessly and effectively across all business areas.
Data quality starts with structure
Rule 1: Every position must have one solid-line manager
Example NDI Query:
Find all positions missing a Manager Position ID or reporting to multiple managers.
NDI generates:
- A table of positions with missing/duplicate managers
- A graph of broken reporting chains
- A narrative insight: “12 positions have no manager assigned, risk of disconnected org nodes.”
Rule 2: Validate dotted-line logic
Show positions where the dotted-line manager equals the solid-line manager or the position itself.
NDI flags cases such as:
- Redundant dotted-line reporting
- Self-reporting loops
These cases are visualized directly in the org graph.
Rule 4: Circular reporting loops
This is historically one of the hardest problems in HR data.
Query:
“Identify any circular reporting loops in the position hierarchy.”
NDI returns:
- A visual cycle (A → B → C → A)
- A recommendation to fix the loop
Position master data completeness
NDI validates fields like Division, Department, Business Unit, Cost Center, Location, and Status.
Example:
“NDI, list positions with missing department, division, or cost center.”
Output includes:
- Missing fields
- Conflicting hierarchies
- Heatmap of departments with most missing data
Job alignment rules
Your dataset contains JobDirectory attributes such as Job Family an Functional Area.
Query examples:
Job existence
“Show positions whose Job Code doesn’t exist in the Job Directory.”
NDI generates:
- Validation tables
Employee-to-Position rules
From the Employee Directory (Employee ID, Position ID, Salary, FTE, gender, age, performance, etc.) , NDI evaluates:
Rule 15: Employee must have zero or one position
Query:
“Show employees assigned to multiple positions or missing a Position ID.”
NDI shows:
- Duplicate assignments
- Potential contractor/temporary cases
- Employees assigned to vacant positions
Rule 17: No employees assigned to vacant positions
“Which vacant positions currently have employees assigned?”
NDI flags:
- Mislabeled vacancy statuses
- FTE mismatches
- Org node inconsistencies
Span of control validation
NDI dynamically calculates actual direct reports using your PositionDirectory structure .
Query:
“Compare declared Span of Control to actual direct reports for all managers.”
NDI produces:
- Bar chart: Declared vs. Calculated span
- List of managers with mismatches
- Insight: “15 managers show declared span > 3 units higher than actual — likely outdated field values.”
Skill data quality & gap analysis
Using EmployeeSkill and PositionSkill tables :
Rule 22: Overlapping skill validity dates
“Identify employees with overlapping skill validity periods.”
Rule 23: Employee skill vs position skill gap
“Show skill gaps by employee, including missing required skills or insufficient proficiency.”
NDI automatically generates:
- Skill gap matrix
- Heatmaps by department
- Recommended upskilling priorities
Compensation & FTE Integrity
Rule 24: Salary vs salary scale
“List employees whose salary falls outside the position salary scale.”
NDI produces:
- Scatter charts
- Quartile analysis
- Pay risk segmentation
Diversity & regulatory quality
Using fields like Gender, Nationality, Ethnicity, Disability :
Query:
“NDI, show missing or non-standard diversity attribute values.”
Then:
“Give me diversity distribution by Business Unit with anomalies.”
NDI narrative example:
“Ethnicity values contain 4 non-standard entries— recommend normalization using corporate taxonomy.”
Referential integrity across all HR data
NDI checks relationships defined in your dataset:
- Employee ↔ EmployeeSkill
- Position ↔ Job
- Position ↔ Employee
- Position ↔ PositionSkill
- EmployeeSkill ↔ PositionSkill
Query:
“Identify orphan records across all HR entities.”
NDI surfaces:
- Employees linked to non-existent positions
- Positions referencing invalid job codes
- Skill records missing parent skill definitions
The real power: HR leaders can ask strategic questions too
Beyond data quality, NDI turns this validated dataset into strategic insight.
Here are questions NDI can answer instantly from your demo dataset :
- “What is the gender distribution across regions and job levels?”
- “Where are the biggest skill gaps impacting critical roles?”
- “Which managers oversee the highest-performing teams?”
- “Which business units face the greatest succession risk?”
- “Where are salary bands misaligned with Hay grades?”
Each question produces graphs, tables, and narrative insights, no analytics team required.
Final thoughts: HR data quality isn’t a project. It’s a capability.
With platforms like Nakisa Decision Intelligence, organizations are finally able to:
- Validate HR data continuously
- Identify structural risks in real time
- Accelerate org design and workforce planning
- Guide leaders with AI-powered narratives
- Switch from reactive reporting to proactive decision intelligence
NDI isn’t just an analytics tool. It’s a workforce decision ecosystem. If you’re a leader, analyst, HRBP, or data-driven strategist, Nakisa Decision Intelligence unlocks organizational insights with a level of clarity and immediacy that simply didn’t exist before. You can request a demo of NDI here, or reach out to your dedicated Client Success Manager to access the preview environment.
I often write about AI and Nakisa innovations. Connect with me on LinkedIn for the latest updates!