
Why it's important to understand the financial impact of operating leases
Operating leases influence both real estate strategy and financial obligations, but their full impact is often difficult to assess. For both real estate and treasury teams, viewing lease commitments in debt-equivalent terms is critical to evaluating financial flexibility, capital allocation, and overall credit profile.
Although operating leases may not always appear as debt in internal reporting, rating agencies treat them as fixed, contractual obligations that behave like debt. Agencies such as S&P Global Ratings routinely adjust financial statements to reflect the economic reality of leases, with the goal of ensuring comparability across companies and industries.
As a result, treasury and finance teams must evaluate operating leases alongside reported debt to ensure leverage metrics, scenario analyses, and funding decisions accurately reflect the organization’s true financial obligations.
For real estate teams, understanding lease obligations in debt-equivalent terms clarifies how portfolio decisions impact financial flexibility and capital allocation, and helps assess the capacity to make strategic investments without adversely affecting leverage or credit metrics.
The visibility gap
The challenge isn’t the existence of lease obligations, but visibility into their true financial impact. In many organizations, lease data is fragmented across multiple systems, making it difficult for treasury, finance, and real estate teams to collaborate efficiently. Credit-style adjustments are often modeled manually in spreadsheets, making it difficult to answer key questions, such as:
- How much do operating leases increase effective leverage?
- How would rating agencies view our lease exposure?
- What happens to leverage if additional debt is raised?
- How sensitive is the credit profile to changes in capital structure?
Without a structured, data-driven approach, these questions take time to answer, and results may be inconsistent or difficult to communicate with stakeholders.
How Nakisa Decision Intelligence helps
Nakisa Decision Intelligence (NDI) addresses this challenge by enabling treasury, finance, and real estate teams to work from a shared dataset, accurately project future lease obligations, apply present-value adjustments, and run multiple scenarios to identify the best course of action. Let’s see NDI in action.
Step-by-step video demo: How to evaluate operating leases for debt, leverage, and credit impact with NDI

In this video, we walk through a structured methodology that enables treasury and real estate leaders to evaluate how operating leases affect leverage and credit posture.
We approach this analysis in three stages, all performed in Nakisa Decision Intelligence (NDI):
- Project future operating lease payments
- Apply S&P-style adjustments to calculate lease-adjusted debt
- Assess leverage and credit impact under different scenarios
Each step uses natural-language prompts to perform calculations and generate visualizations that align with how rating agencies like S&P assess credit risk.
Step 1: Project future operating lease obligations
The first step is to quantify all legally binding operating lease payments as of the evaluation date. This will give us a transparent view of future cash commitments that behave like fixed financial obligations.
We begin by selecting the global lease portfolio dataset, which contains all leases, key terms, renewal options, and payment schedules. To understand the portfolio at a high level, we first identify the split between finance and operating leases.
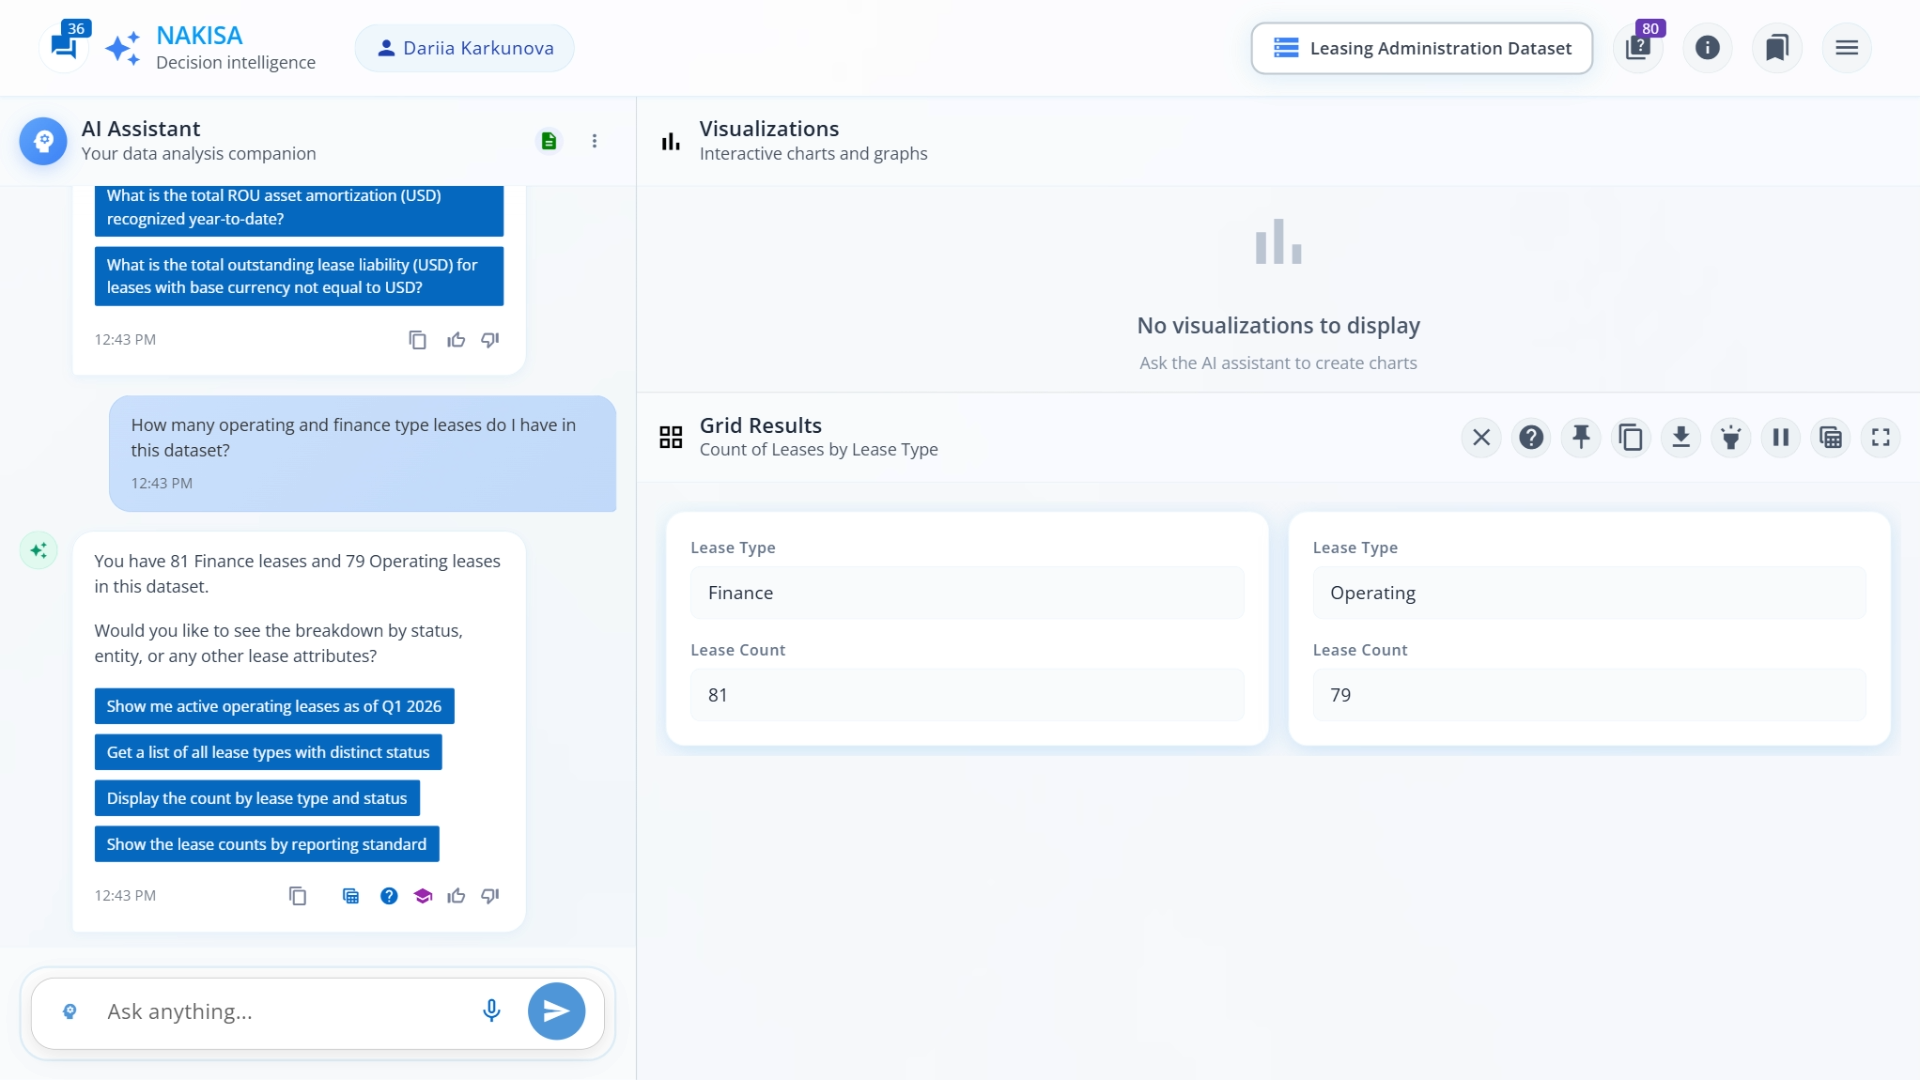
Prompt: How many operating and finance type leases do I have in this dataset?
NDI generates a summary table showing the total number of finance vs. operating leases, giving an immediate snapshot of the portfolio’s composition.
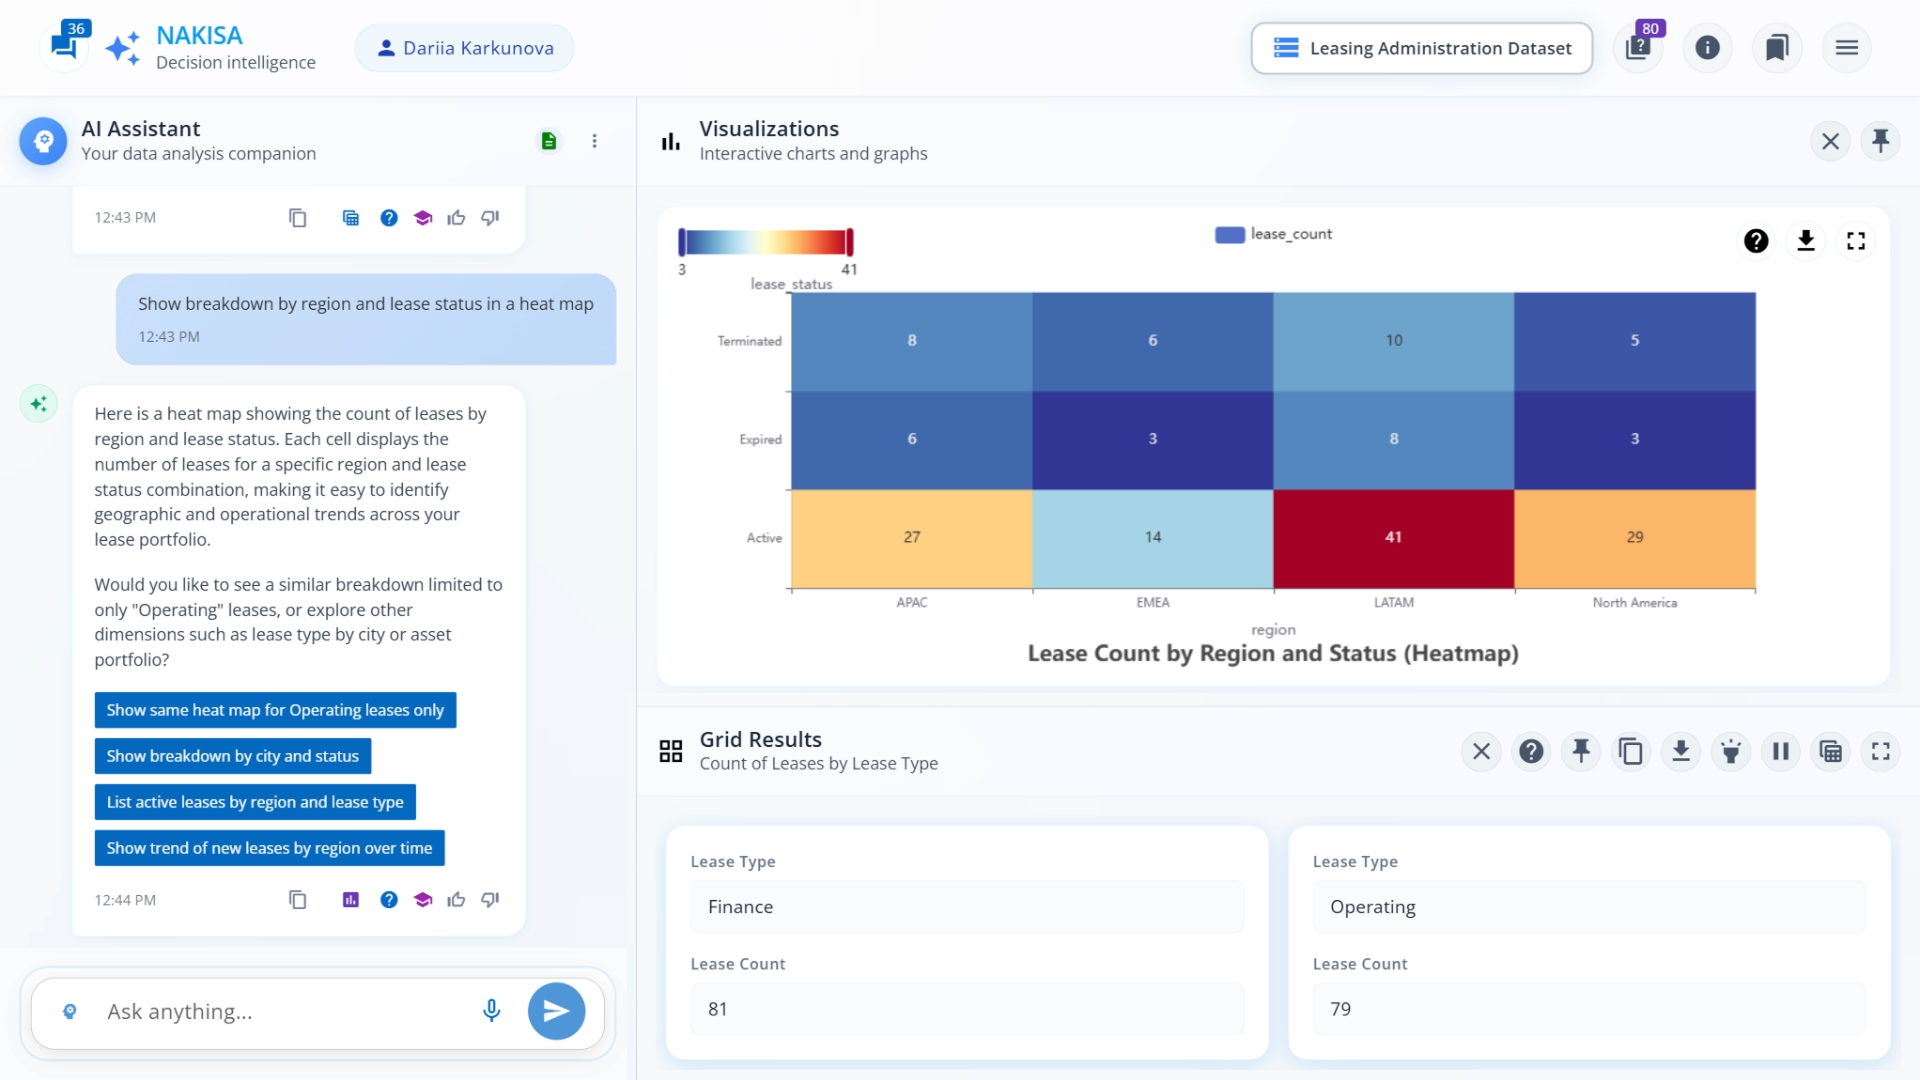
Next, we analyze the portfolio by region and lease status to identify concentrations, regional risk, or patterns that may affect financial flexibility.
Prompt: Show breakdown by region and lease status in a heat map.
NDI creates an interactive heat map highlighting where leases are concentrated by type, status, and geography. This allows teams to quickly visualize exposure and identify potential areas for deeper analysis.
Finally, we focus on active operating leases and project their future quarterly payments starting from the next evaluation period. This step ensures that only legally binding, active obligations are included in subsequent debt-equivalent and leverage calculations.
Prompt: Set the evaluation quarter to Q1 2026. For this analysis, include only active operating leases as of that quarter.
NDI applies the filter and prepares the dataset for projection.
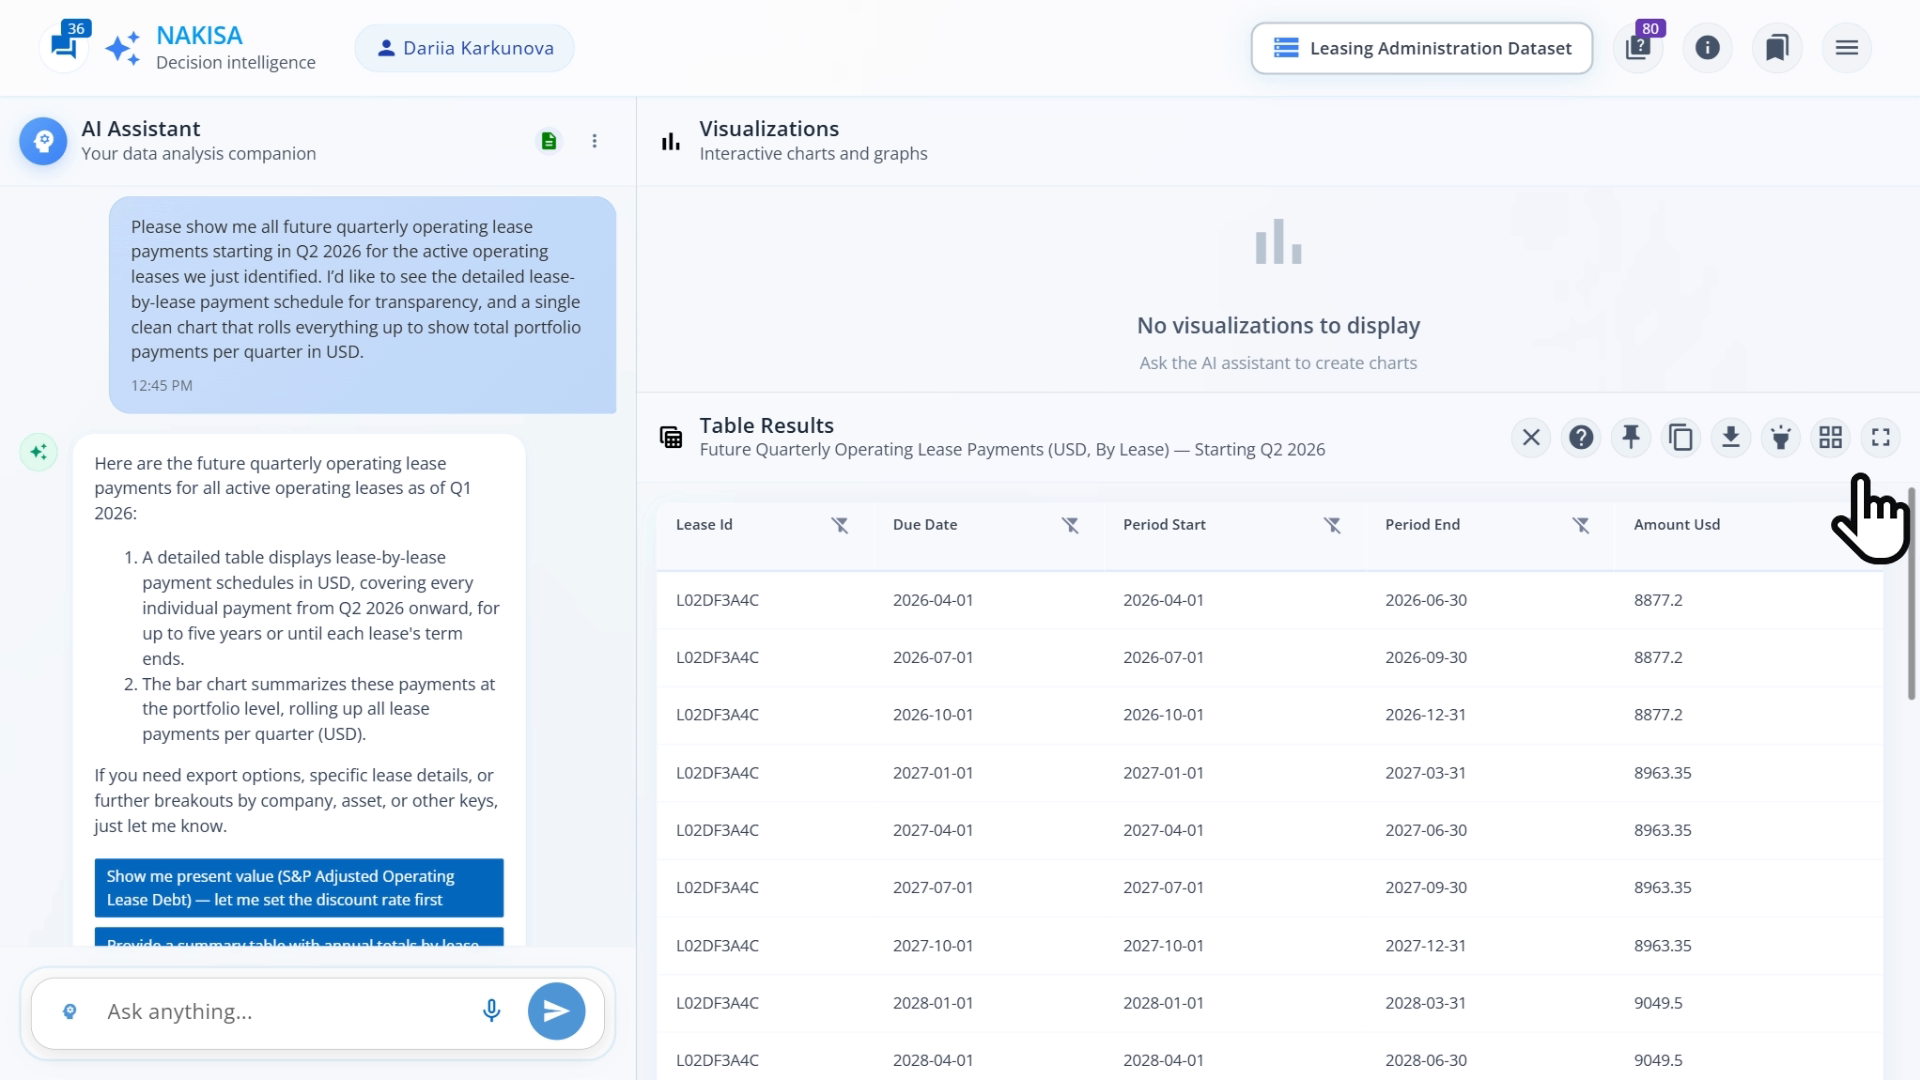
Prompt: Show me all future quarterly operating lease payments starting in Q2 2026 for the active operating leases we just identified. I’d like to see the detailed lease-by-lease payment schedule per quarter in USD.
NDI generates a detailed lease-by-lease payment table showing each lease’s quarterly payment in USD. The table can be sorted by due date, amount, or lease attributes to provide deeper insight into the portfolio.
With this step complete, teams now have full visibility into all future operating lease obligations, creating a solid foundation for the next stages: present value adjustments and scenario modeling to assess debt and leverage impact.
Step 2: Apply S&P adjustments to calculate lease-adjusted debt
Credit analysts don’t treat operating leases as simple expenses. Because they are fixed, contractual obligations, they behave much like debt. In this step, we apply rating-agency adjustments to quantify lease exposure and convert future payments into a debt-equivalent figure.
We discount all future quarterly operating lease payments back to the evaluation date using a user-defined rate. This present-value calculation reflects the economic reality of lease obligations, similar to the adjustments rating agencies such as S&P apply.
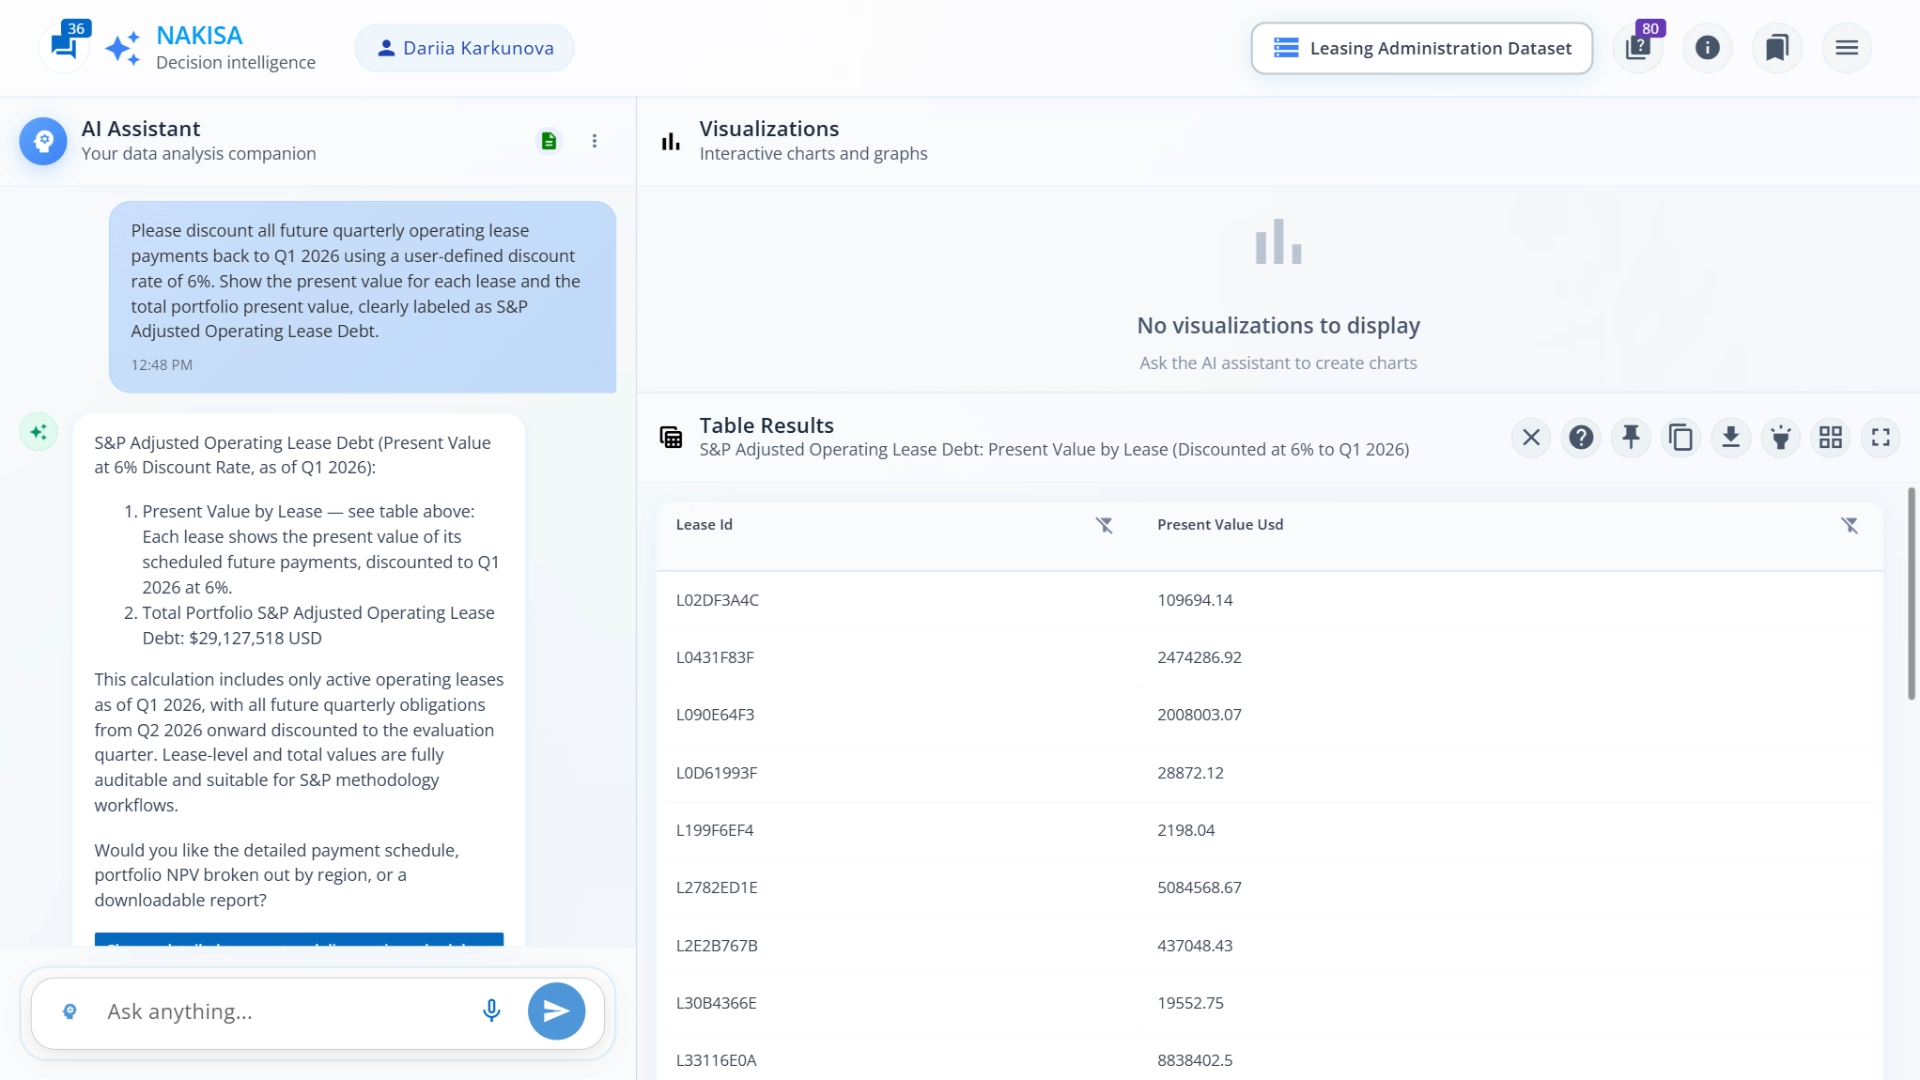
Prompt: Discount all future quarterly operating lease payments back to Q1 2026 using a user-defined discount rate of 6%. Show the present value for each lease and the total portfolio present value, clearly labeled as S&P Adjusted Operating Lease Debt.
NDI calculates the present value for each lease and the total portfolio, clearly labeled as S&P-Adjusted Operating Lease Debt. This converts future lease payments into a debt-equivalent figure, providing a comparable measure alongside reported financial debt.
Next, we examine the quarterly rent expense for these same active operating leases. This is important because rent expense is used in EBITDA adjustments, which feed into credit models and leverage calculations.
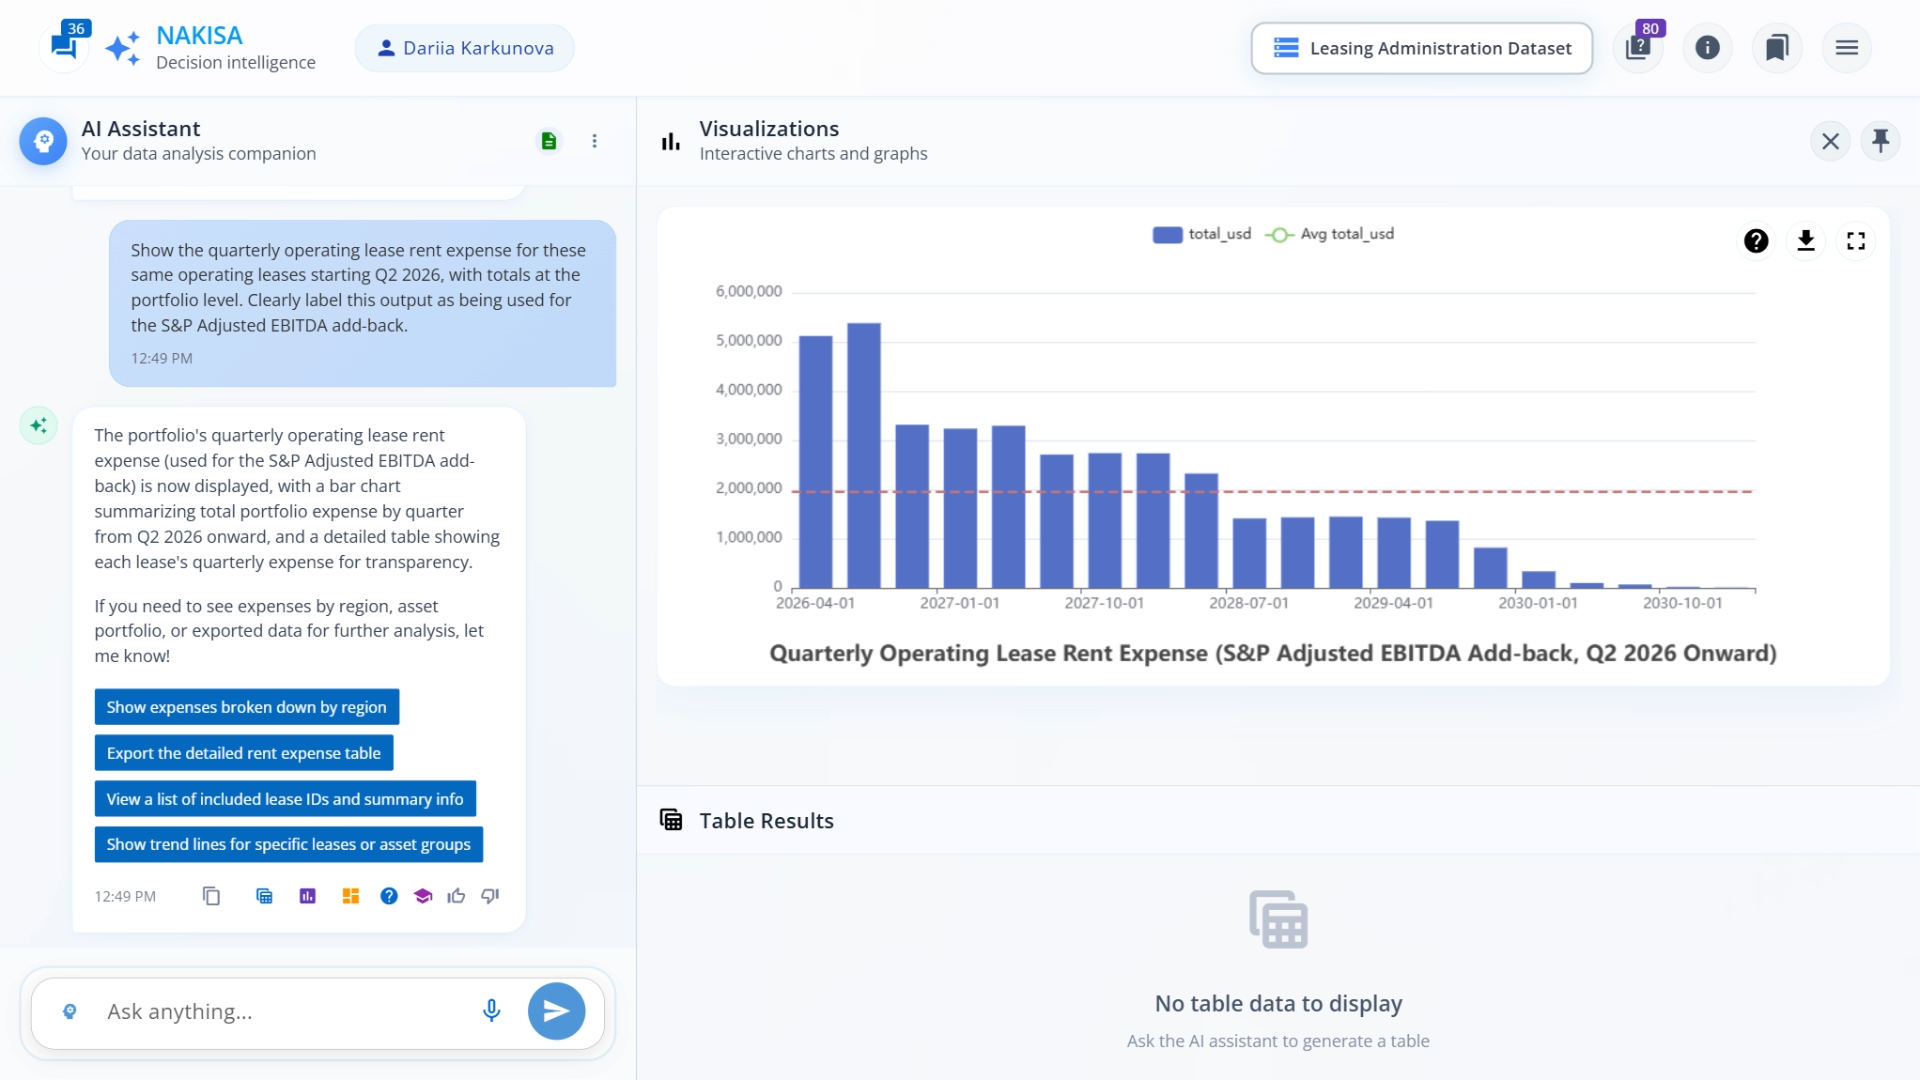
Prompt: Show the quarterly operating lease rent expense for these same operating leases starting Q2 2026, with totals at the portfolio level. Clearly label this output as being used for the S&P Adjusted EBITDA add-back.
NDI generates a bar chart showing total portfolio rent expense per quarter, which can be used as an input for S&P-style EBITDA adjustments. This provides teams with a clear visualization of cash outflows over time and ensures consistency in credit modeling.
By capitalizing operating leases at present value, we now have a debt-equivalent measure that can be directly compared with reported financial debt. This step aligns internal analysis with rating-agency methodology, enabling treasury, finance, and real estate teams to make informed decisions about leverage and portfolio strategy.
Step 3. Assess leverage and credit impact under different scenarios
With lease-adjusted debt calculated, we can now evaluate leverage ratios and simulate how changes in capital structure affect the organization’s credit posture.
We begin by comparing reported financial debt to lease-adjusted debt, which adds the present value of operating leases to the balance sheet. This highlights the incremental impact of lease obligations on total debt.
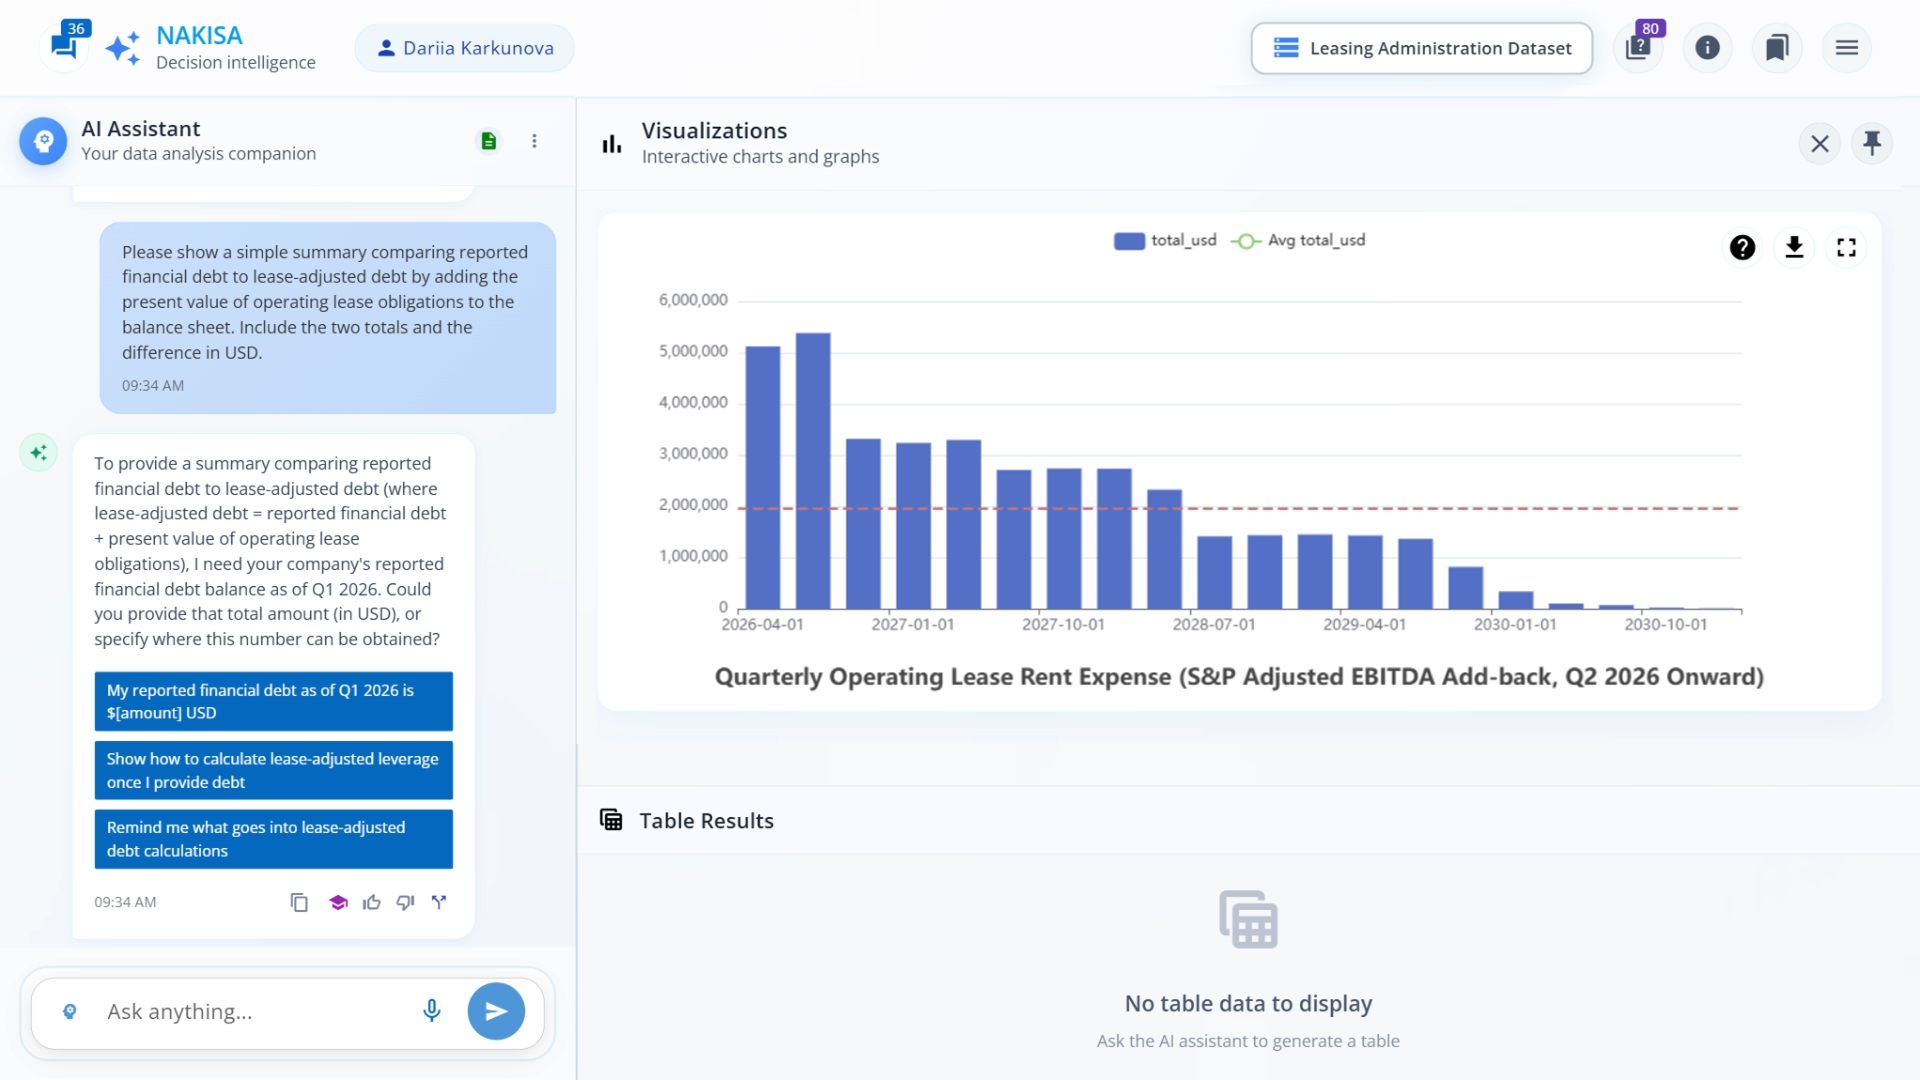
Prompt: Show a summary comparing reported financial debt to lease-adjusted debt by adding the present value of operating lease obligations to the balance sheet. Include both totals and the difference in USD.
At this point, NDI requests the reported financial debt as of the evaluation date to complete the comparison.
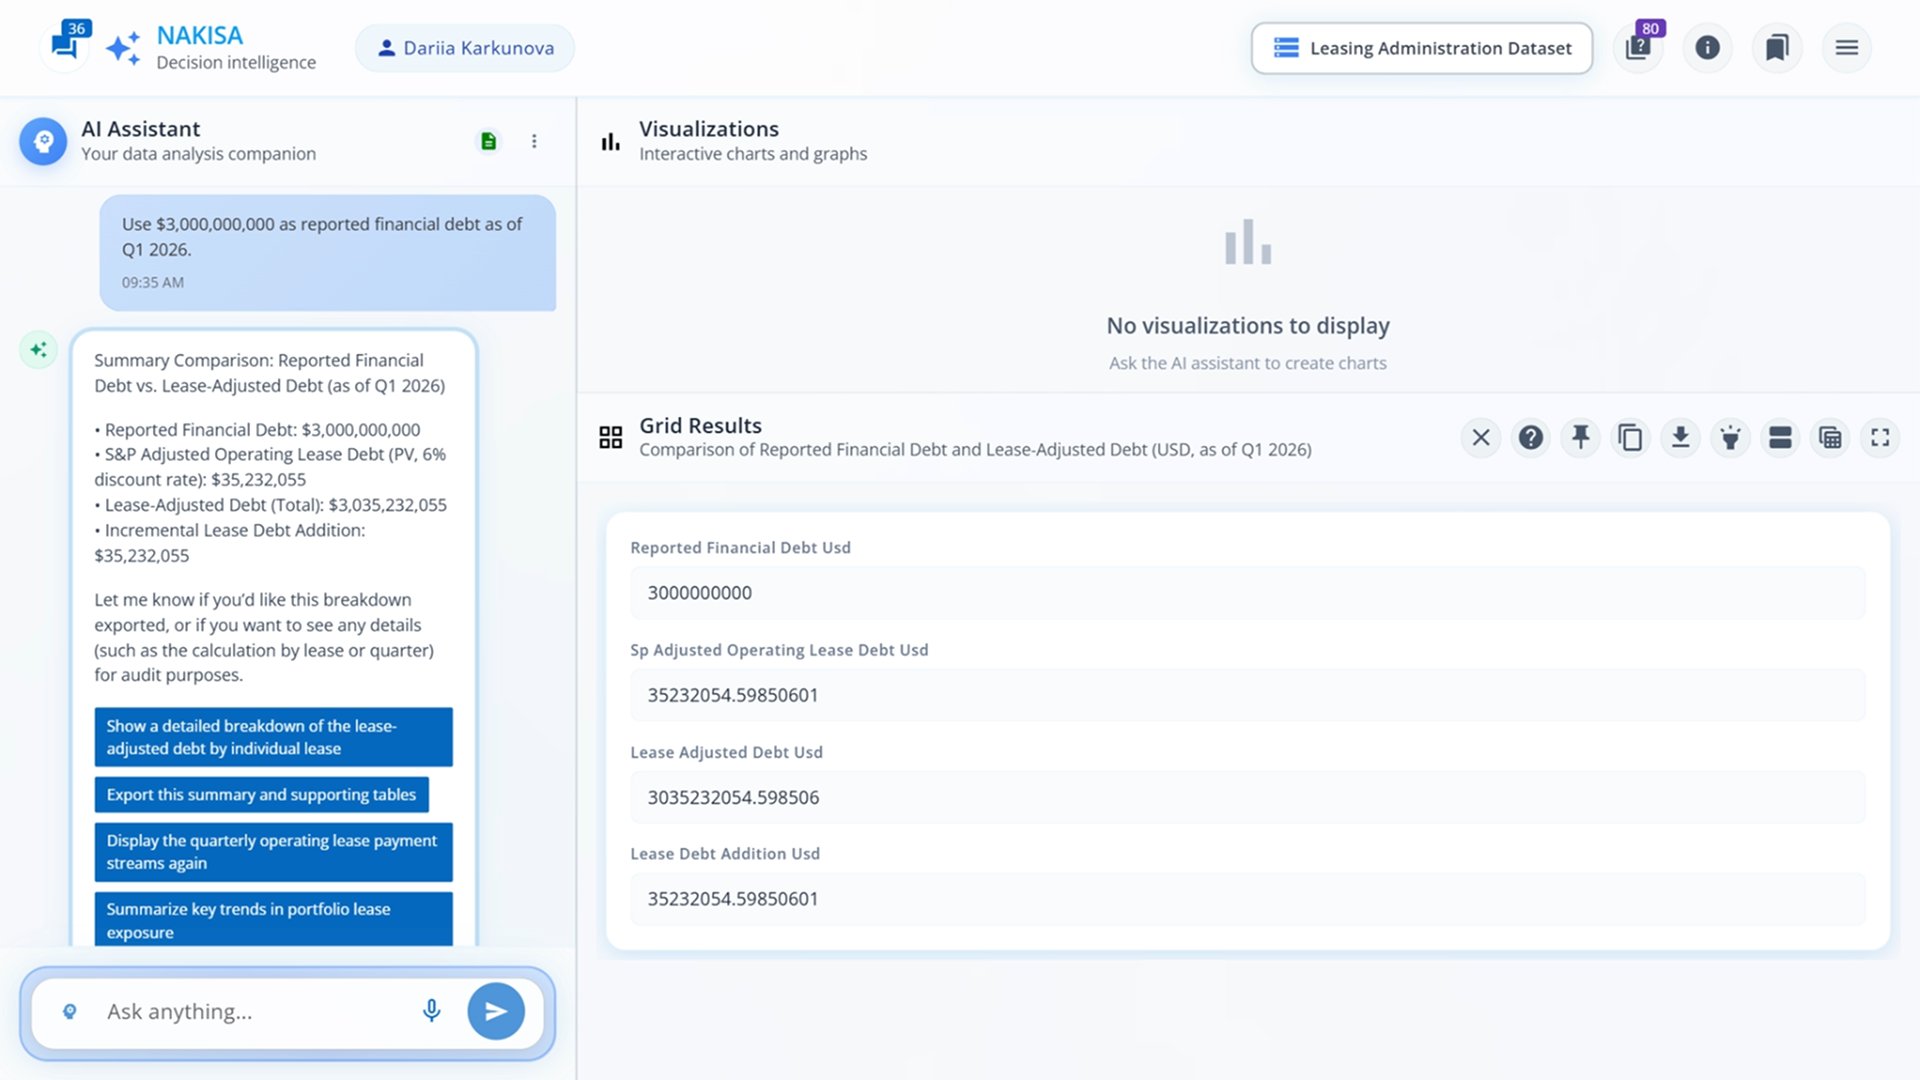
Prompt: Use $3,000,000,000 as reported financial debt as of Q1 2026.
Once the input is provided, NDI generates the comparison between reported financial debt and lease-adjusted debt. By capitalizing operating leases, total debt increases slightly, from $3.0 billion dollars to just over $3.03 billion, making the incremental impact of lease liabilities clear in dollar terms.
Next, we calculate leverage ratios to assess credit impact. Using EBITDA as a reference, teams can see how capitalizing operating leases changes debt metrics that rating agencies monitor.
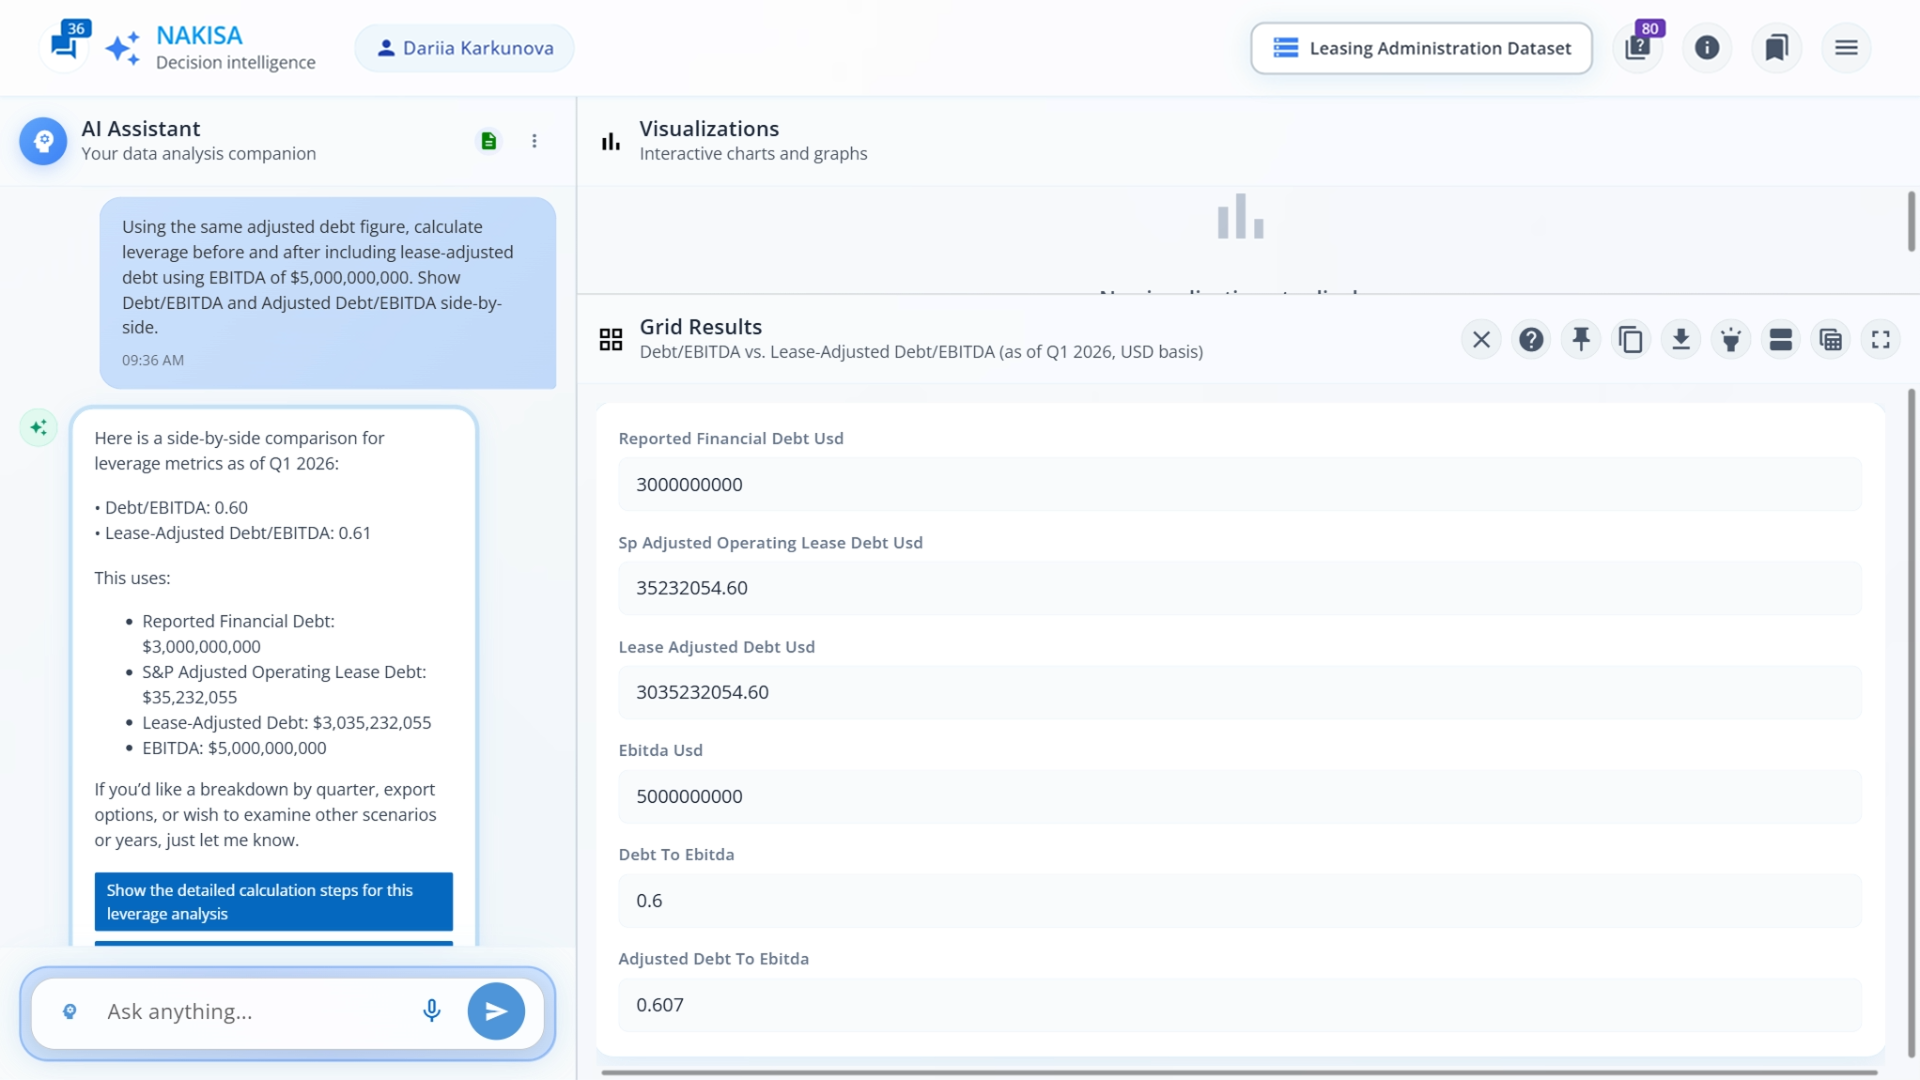
Prompt: Using the same adjusted debt figure, calculate leverage before and after including lease-adjusted debt using EBITDA of $5,000,000,000. Show Debt/EBITDA and Lease-Adjusted Debt/EBITDA side-by-side.
NDI creates a table showing Debt/EBITDA and Lease-Adjusted Debt/EBITDA. Because the lease balance is modest relative to EBITDA, the leverage ratio only increases slightly: from point 0.60x to 0.61x.
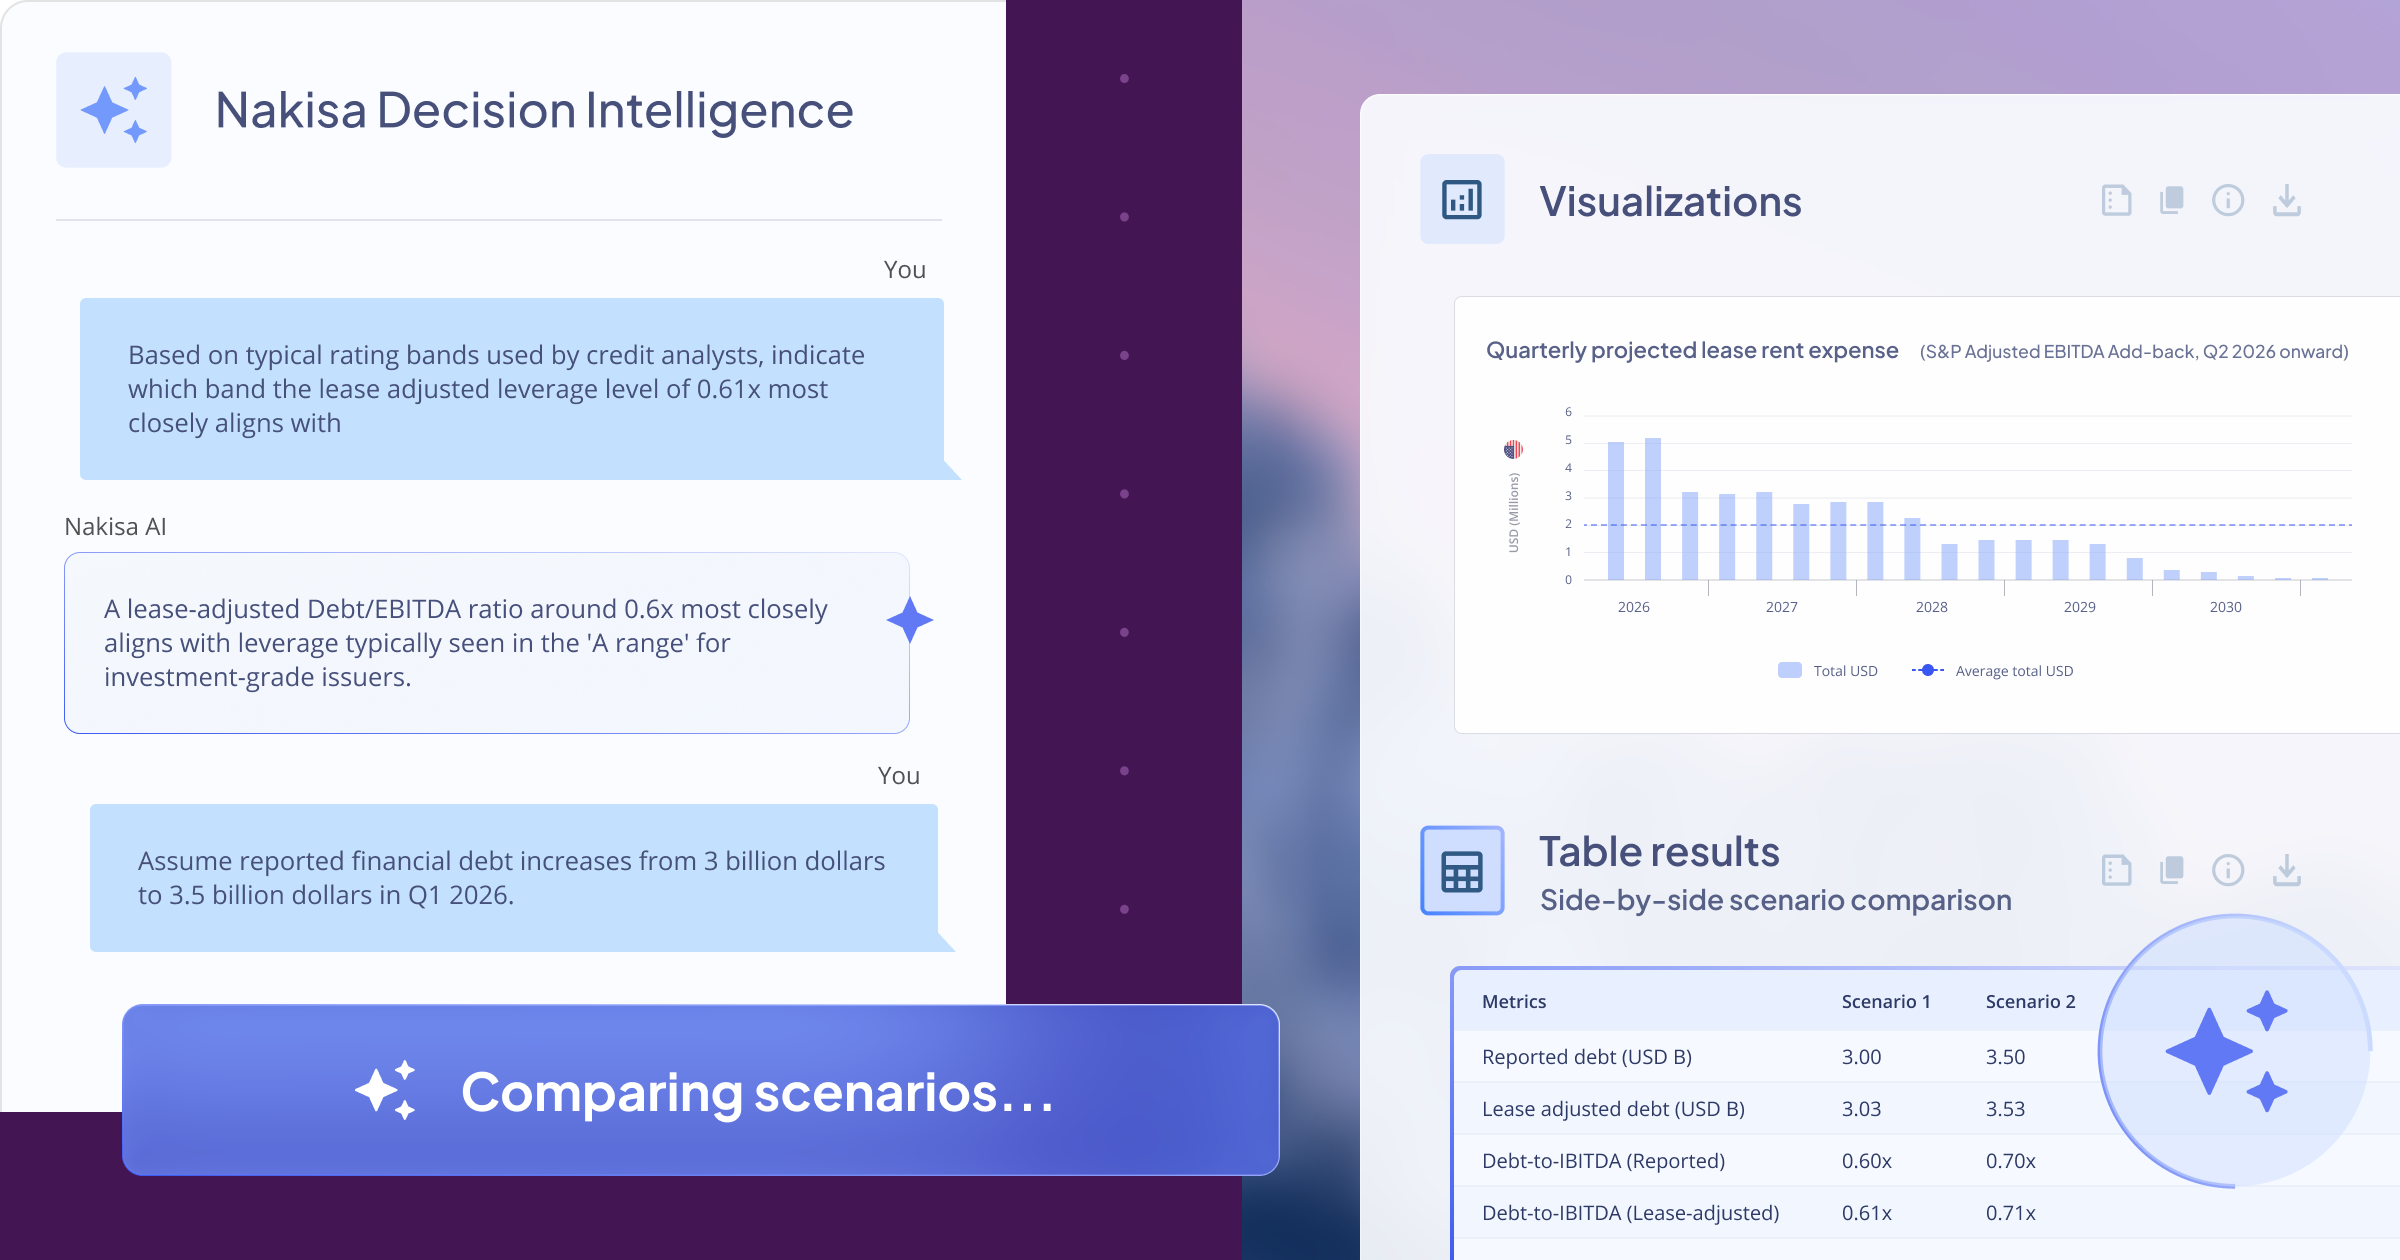
To provide additional context, we compare the results to typical credit rating bands. Let’s just ask NDI about that.
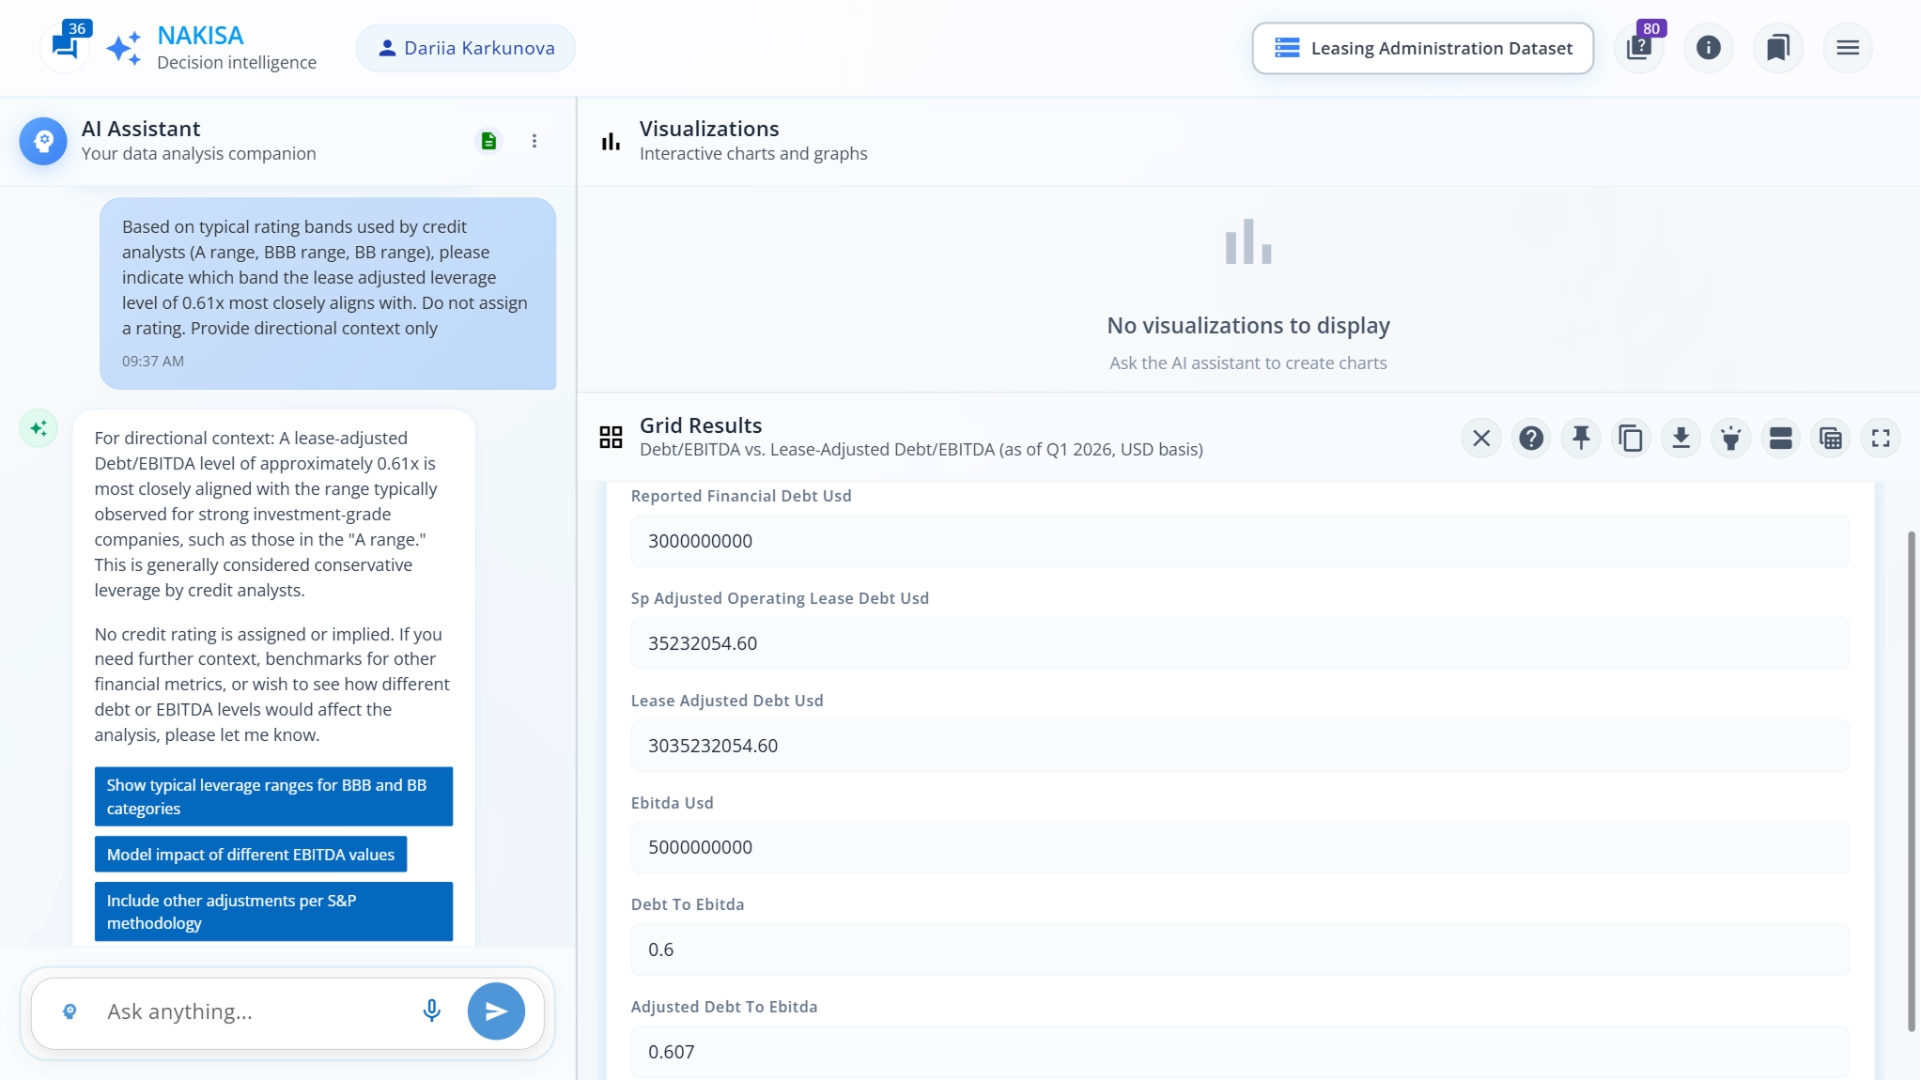
Prompt: Based on typical rating bands used by credit analysts (A range, BBB range, BB range), indicate which band the lease-adjusted leverage level of 0.61x most closely aligns with. Do not assign a rating. Provide directional context only.
NDI indicates that a leverage of 0.61x falls within the A-range band. From a finance perspective, this confirms that the incremental debt from capitalized leases is modest relative to EBITDA, and that the organization maintains strong credit metrics.
Finally, we evaluate how leverage changes under an alternative funding scenario.
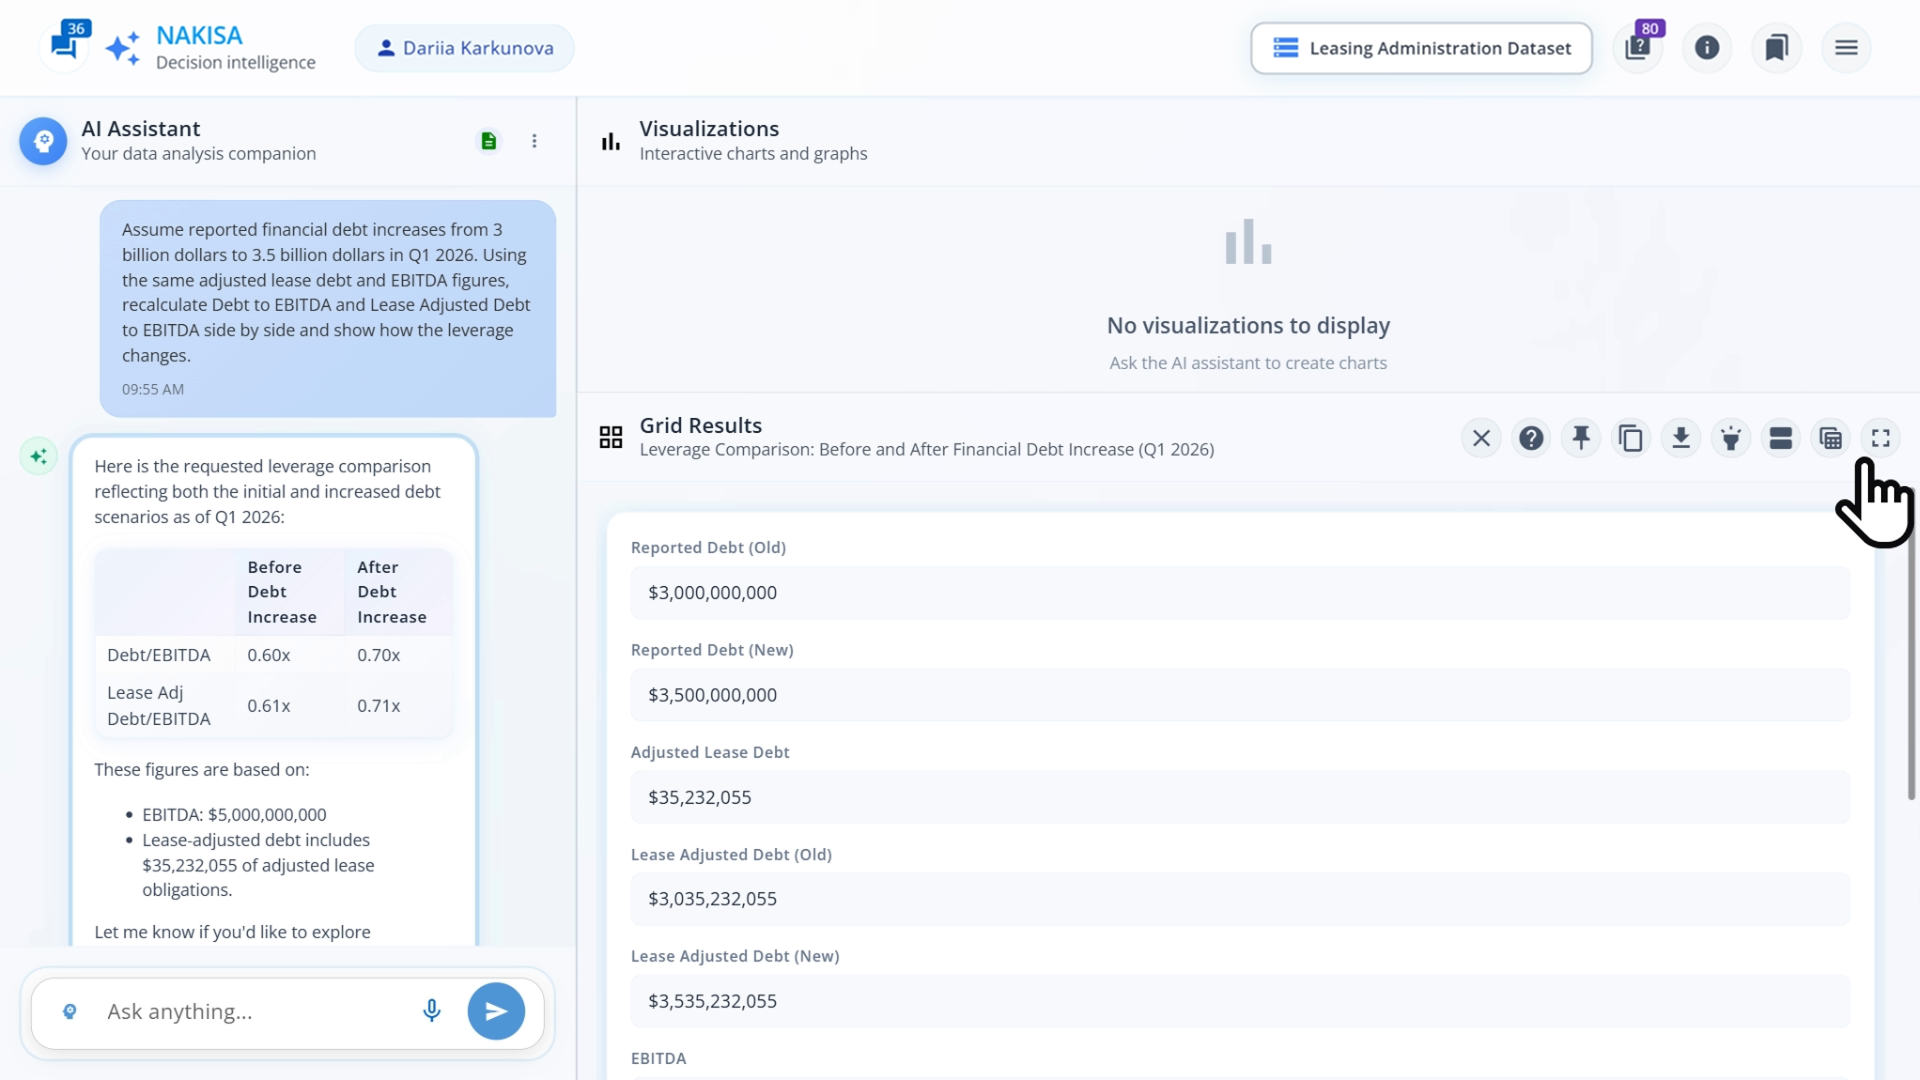
Prompt: Assume reported financial debt increases from $3.0 billion to $3.5 billion in Q1 2026. Using the same adjusted lease debt and EBITDA figures, recalculate Debt to EBITDA and Lease Adjusted Debt to EBITDA side by side and show how leverage changes.
NDI provides a comparison table for both scenarios, showing that in the second scenario, leverage increases to 0.70x on a reported basis and 0.71x on a lease-adjusted basis. This scenario simulation helps finance teams understand how lease obligations interact with additional borrowing.
With these final steps, we’ve shown how capitalizing operating leases affects total debt, leverage, and directional credit posture, and how those results shift under alternative funding scenarios.
Conclusion: the power of decision intelligence platforms
In just a few minutes, and through simple conversational prompts to Nakisa Decision Intelligence, we accomplished what traditionally would have taken days of manual analysis. We have:
- Identified all active operating leases and projected future cash obligations
- Capitalized future lease payments into debt‑equivalent values using rating‑agency‑aligned logic
- Compared reported financial debt with lease‑adjusted debt to reveal true leverage exposure
- Calculated leverage ratios before and after including lease obligations
- Simulated alternative scenarios to understand how changes in reported debt affect credit posture
As we have seen, Nakisa Decision Intelligence transforms lease and credit analysis from a tedious, technical exercise into an intuitive, guided process. By combining natural‑language prompts with AI‑powered analysis, NDI empowers treasury and real estate leaders to assess leverage and credit impact confidently without requiring advanced technical or actuarial expertise. What’s more, NDI’s answers and recommendations are fully explainable and traceable. Users can see exactly how a calculation was performed, understand the reasoning behind each recommendation, and revisit it later for compliance or audit purposes.
Ready to explore deeper decision insights into your portfolio and capital strategy? Visit the Nakisa Decision Intelligence Resource Hub to learn more or ask for a tailored demo to experience NDI firsthand.