
1. Org Chart Suite enhancements: elevating organizational clarity and advanced analytics
We continue to expand the Org Chart Suite, advancing organizational visualization and analytics capabilities to give our clients the most clarity possible into their structures, roles, employees, skills, and more.
The Org Chart Suite enhancements include:
1.1 In-chart custom analytics: tailored insights within org charts
Every organization has unique metrics that matter, whether it’s overall salary costs, tenure calculations, or other custom data points. Admins can now create and manage custom analytics for position and employee views in the new Custom Analytics page, which then appear alongside built-in metrics in the Org Chart’s display options. Users can easily toggle these custom analytics on or off to tailor the org chart view.
This update empowers organizations to surface these insights directly within the org chart, making data-informed decisions simpler during planning, reviews, and team discussions.

1.2 Display Options: smarter node filtering and custom admin settings
A New Display Options panel makes it easier to focus on what matters most, especially in large org charts. Its built-in filters let you toggle the visibility of roles like non-manager vacant positions, individual contributors, contractor roles, and more. When a node is hidden, all its child nodes are automatically hidden as well, unless specifically included in the filter, even if they don’t meet the filter criteria. This behavior helps declutter large organizational structures, allowing teams to focus on the roles and insights that matter most.
Admins can now define custom filters from a new Settings page, offering even more control over how org charts are displayed. These custom filters appear alongside the built-in ones and follow the same hide-node-and-children logic. This makes it easy to tailor the org chart to reflect unique team structures or specific planning needs, ensuring each view supports your organization’s priorities.

1.3 Dimmed nodes for unmatched positions: better filtering in org chart analytic views
With smarter node filtering, large org charts are easier to navigate and customize. In the analytic view of the org chart, filters are now more intuitive thanks to the introduction of dimmed nodes for unmatched positions. When a filter is applied, roles that don’t meet the criteria are visually dimmed, making it easier to focus on the relevant parts of the organization while still keeping the full structure visible. These dimmed nodes remain fully interactive, users can read, click, and expand them as needed.
In addition, Admins can now create and manage custom filters from a new Settings page. These custom filters work just like the built-in ones, using the same dim-and-highlight logic to improve clarity. This enhancement is especially useful during headcount planning, role audits, and structural analysis, helping users quickly identify open roles, key teams, or planning segments without losing sight of the overall context. Custom filters also offer the flexibility to tailor views to specific organizational needs and workflows.

In Nakisa’s org chart software, dimmed nodes for unmatched positions help improve filtering in org chart analytic views.
1.4 Executive dashboard: easy, centralized access to essential insights
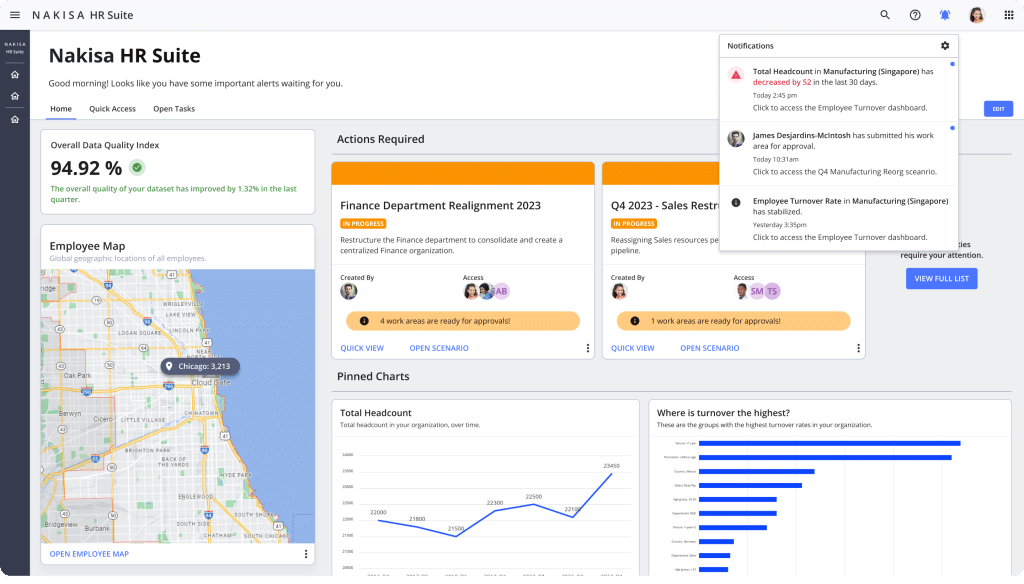
A new Executive Summary Dashboard is now available in default dashboards, offering a high-level view of key workforce metrics and a clear visual snapshot of the organization’s health for leadership and planning teams. Designed as a flexible template, it can be used as is or customized as needed. Admins can control access through three independent toggles in Admin Settings: Enable Dashboards, Enable Employee Dashboard, and Enable Executive Summary Dashboard.
This update gives leaders quick, centralized access to essential workforce insights, directly within the org chart, while allowing deployment teams to tailor visibility based on organizational needs.

The Executive Dashboard in Nakisa’s org chart software delivers essential insights through a centralized, user-friendly interface.
1.5 Automated manager inheritance: clear org charts despite incomplete data
We enhanced the manager inheritance display feature to help maintain accurate reporting structures when an org unit has no managing position or its managing position is currently vacant. It intelligently identifies and displays the inherited manager, which is the next available manager found by climbing up the org unit hierarchy. If no manager is found by the time the root is reached, the position remains vacant.
This update makes it easier to review reporting relationships, especially during planning, audits, and structural reviews. Admins can enable or disable this functionality using a toggle under the org chart section in the Admin Settings panel (default is off).
1.6 More chart types available in the Nakisa AI Agent for analytics
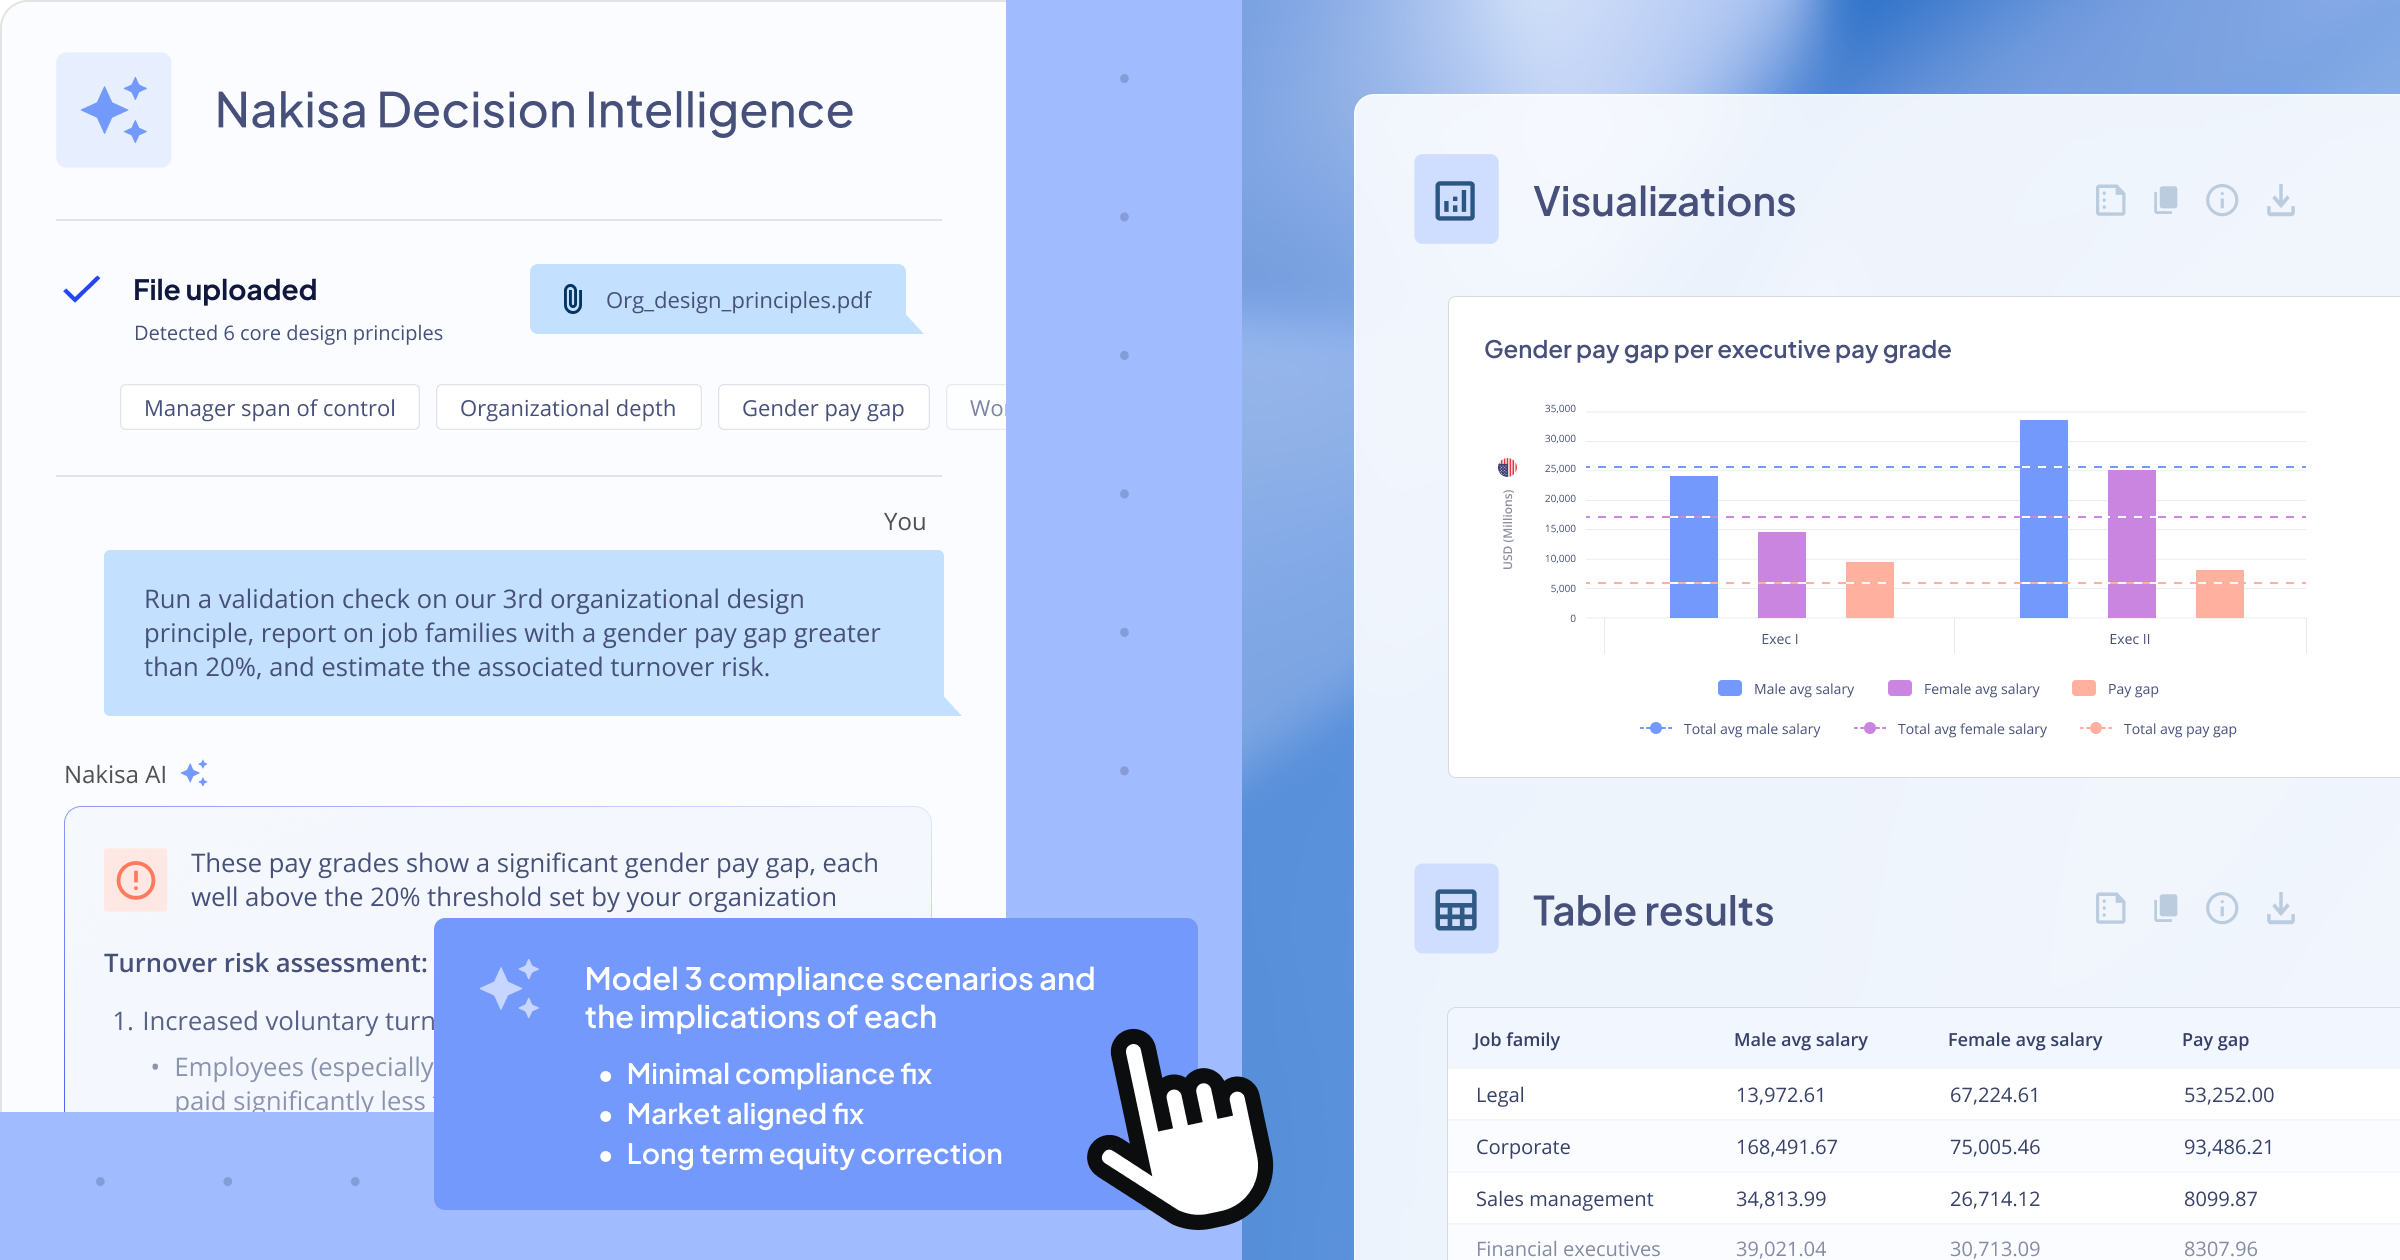
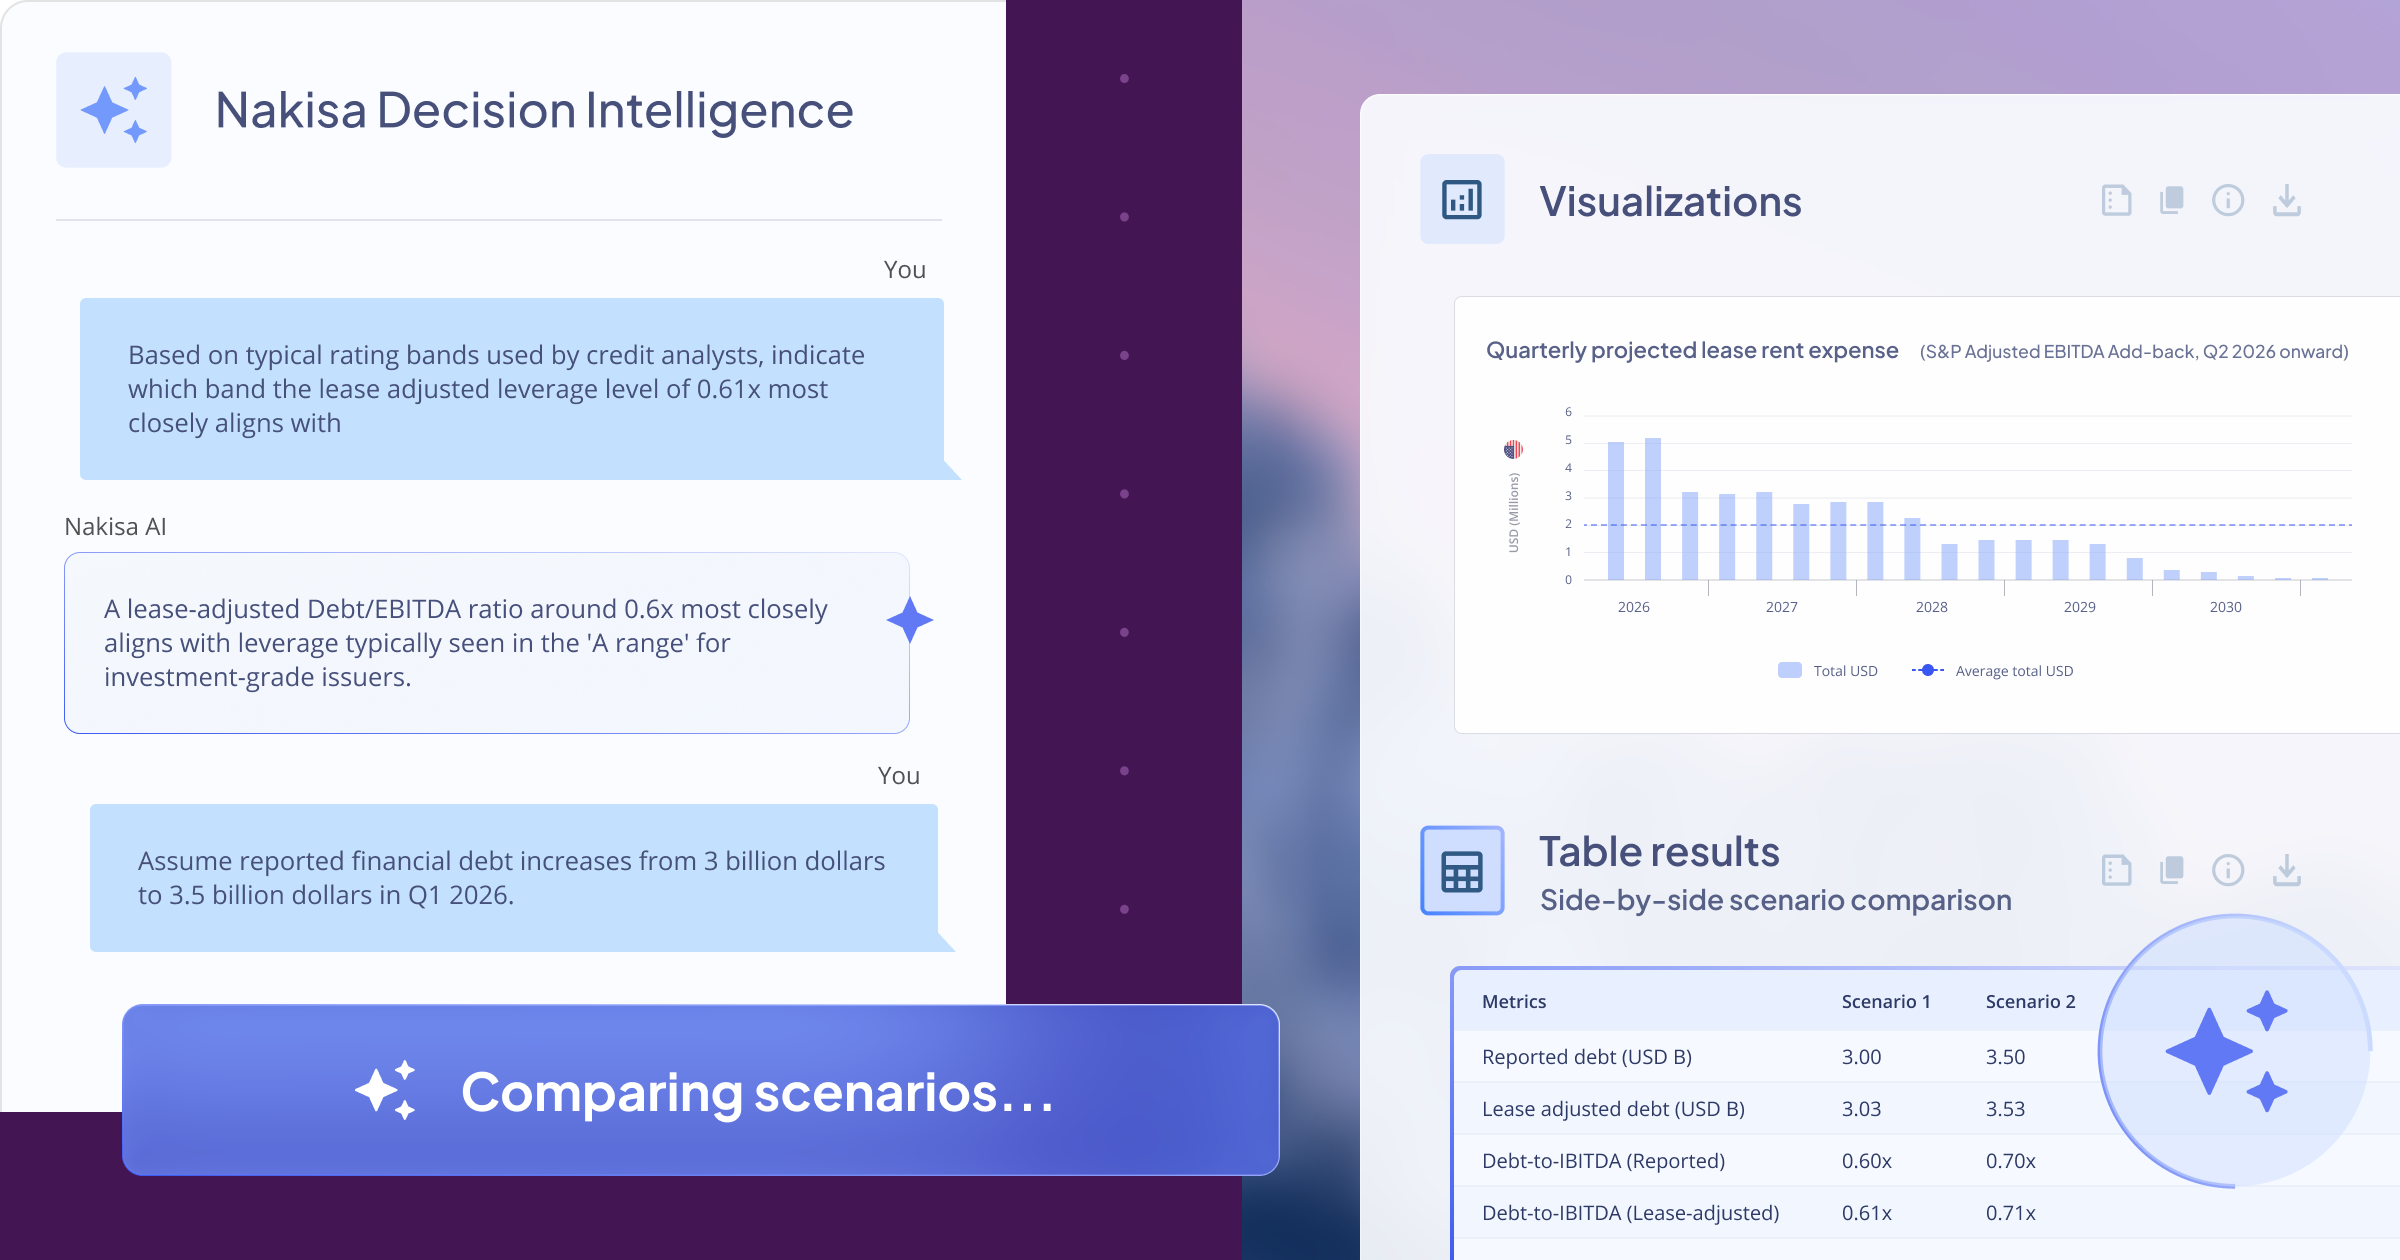
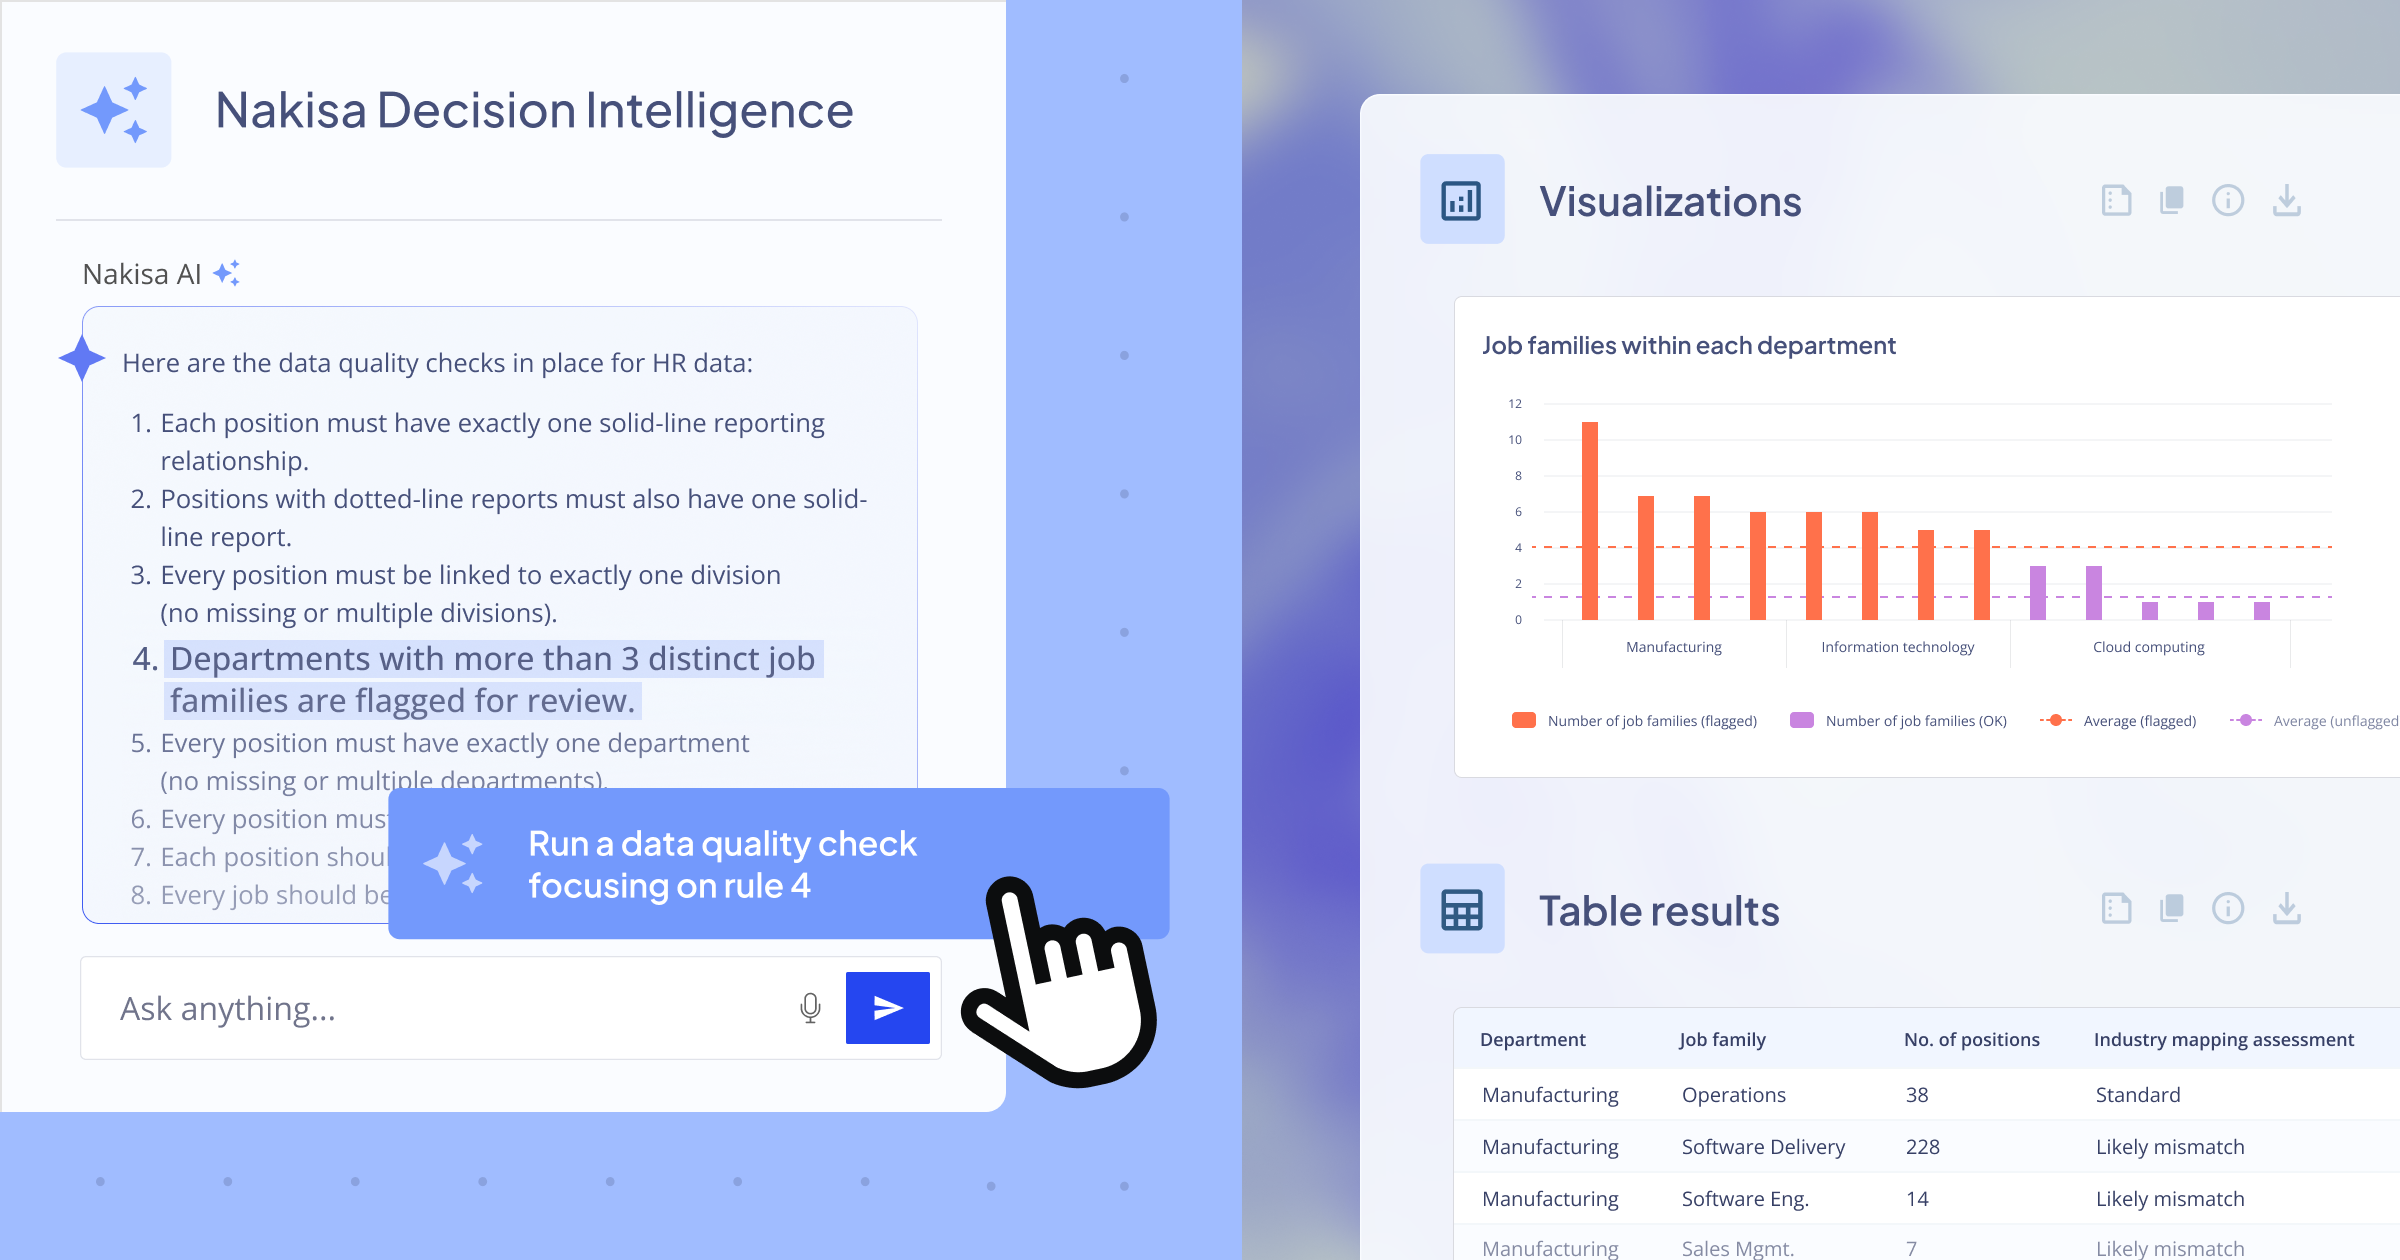
The Nakisa AI Agent for analytics transforms how you explore and interpret your workforce data. With a simple prompt, it automatically analyzes key datasets, such as headcount, skills, cost, layer, and span of control, and turns them into clear, actionable insights using charts, metrics, and indicators. This minimizes manual effort and enables HR and executive teams to quickly identify trends and optimize workforce strategies with confidence.
The enhanced AI agent now supports a wider variety of chart types, including pivot tables, metrics, bubble charts, and sunburst diagrams, offering greater flexibility and richer visualizations for every analysis need.
The agent is currently in Beta and available to all users. It’s enabled by default, but Admins can disable it via a new switch added to the General Settings page under Global Settings. We’d love to hear about your experience with this agent. Please share your feedback with your dedicated Nakisa Client Success Manager.

1.7 Additional functionalities for more streamlined org visualization and analytics
The latest release includes additional enhancements to the Org Chart Suite, such as:
- Simplified chart creation
We redesigned the dashboard's chart creation interface to enhance usability and improve the overall creation process. - Improved directory customization and exporting
Users can now add columns to directories, export directories, and dashboards in the list view, as well as pivot table charts as JSON files.
Start using these functionalities in Nakisa
In-chart analytics, custom filters, the executive dashboard, and automated manager inheritance must be enabled by Admins. All other updates are automatically enabled in the Org Chart Suite. Simply log in to the suite and start using the new features.
To get access to our Org Chart product, please reach out to your dedicated Nakisa Client Success Manager.
2. Org Design Suite enhancements: strategic flexibility for enterprises
This release brings greater strategic power and operational agility to the Org Design Suite, empowering enterprises to adapt and thrive. Whether planning for growth, restructuring, or managing ongoing changes, these enhancements put robust tools at your fingertips. You can confidently design and implement plans for both large-scale transformations and ongoing operational adjustments across your organization.
With the recent upgrade of Nakisa Strategic Org Design to our latest technology, this release builds on the scenario creation and collaboration framework, making it easier to plan, track, and share scenarios. Key enhancements include:
2.1 Enhanced scenario creation and editing
A comprehensive update makes it easier than ever to create, view, and edit org design scenarios. You can make detailed structural changes directly within the org chart, including creating new positions, moving roles, editing position and employee details, deleting items, and cloning positions (i.e., copying a position’s attributes to save time), all within a single streamlined experience.
Multi-select capabilities allow you to drag and drop multiple positions for bulk moves. You can also assign or update incumbents by right-clicking and editing roles directly. Any changes made, whether structural or personnel-related, are reflected instantly in the org chart.
These enhancements support more agile scenario planning, future-state modeling, and what-if analyses, enabling HR and business leaders to manage reorganizations, growth plans, and strategic changes with greater speed and precision.

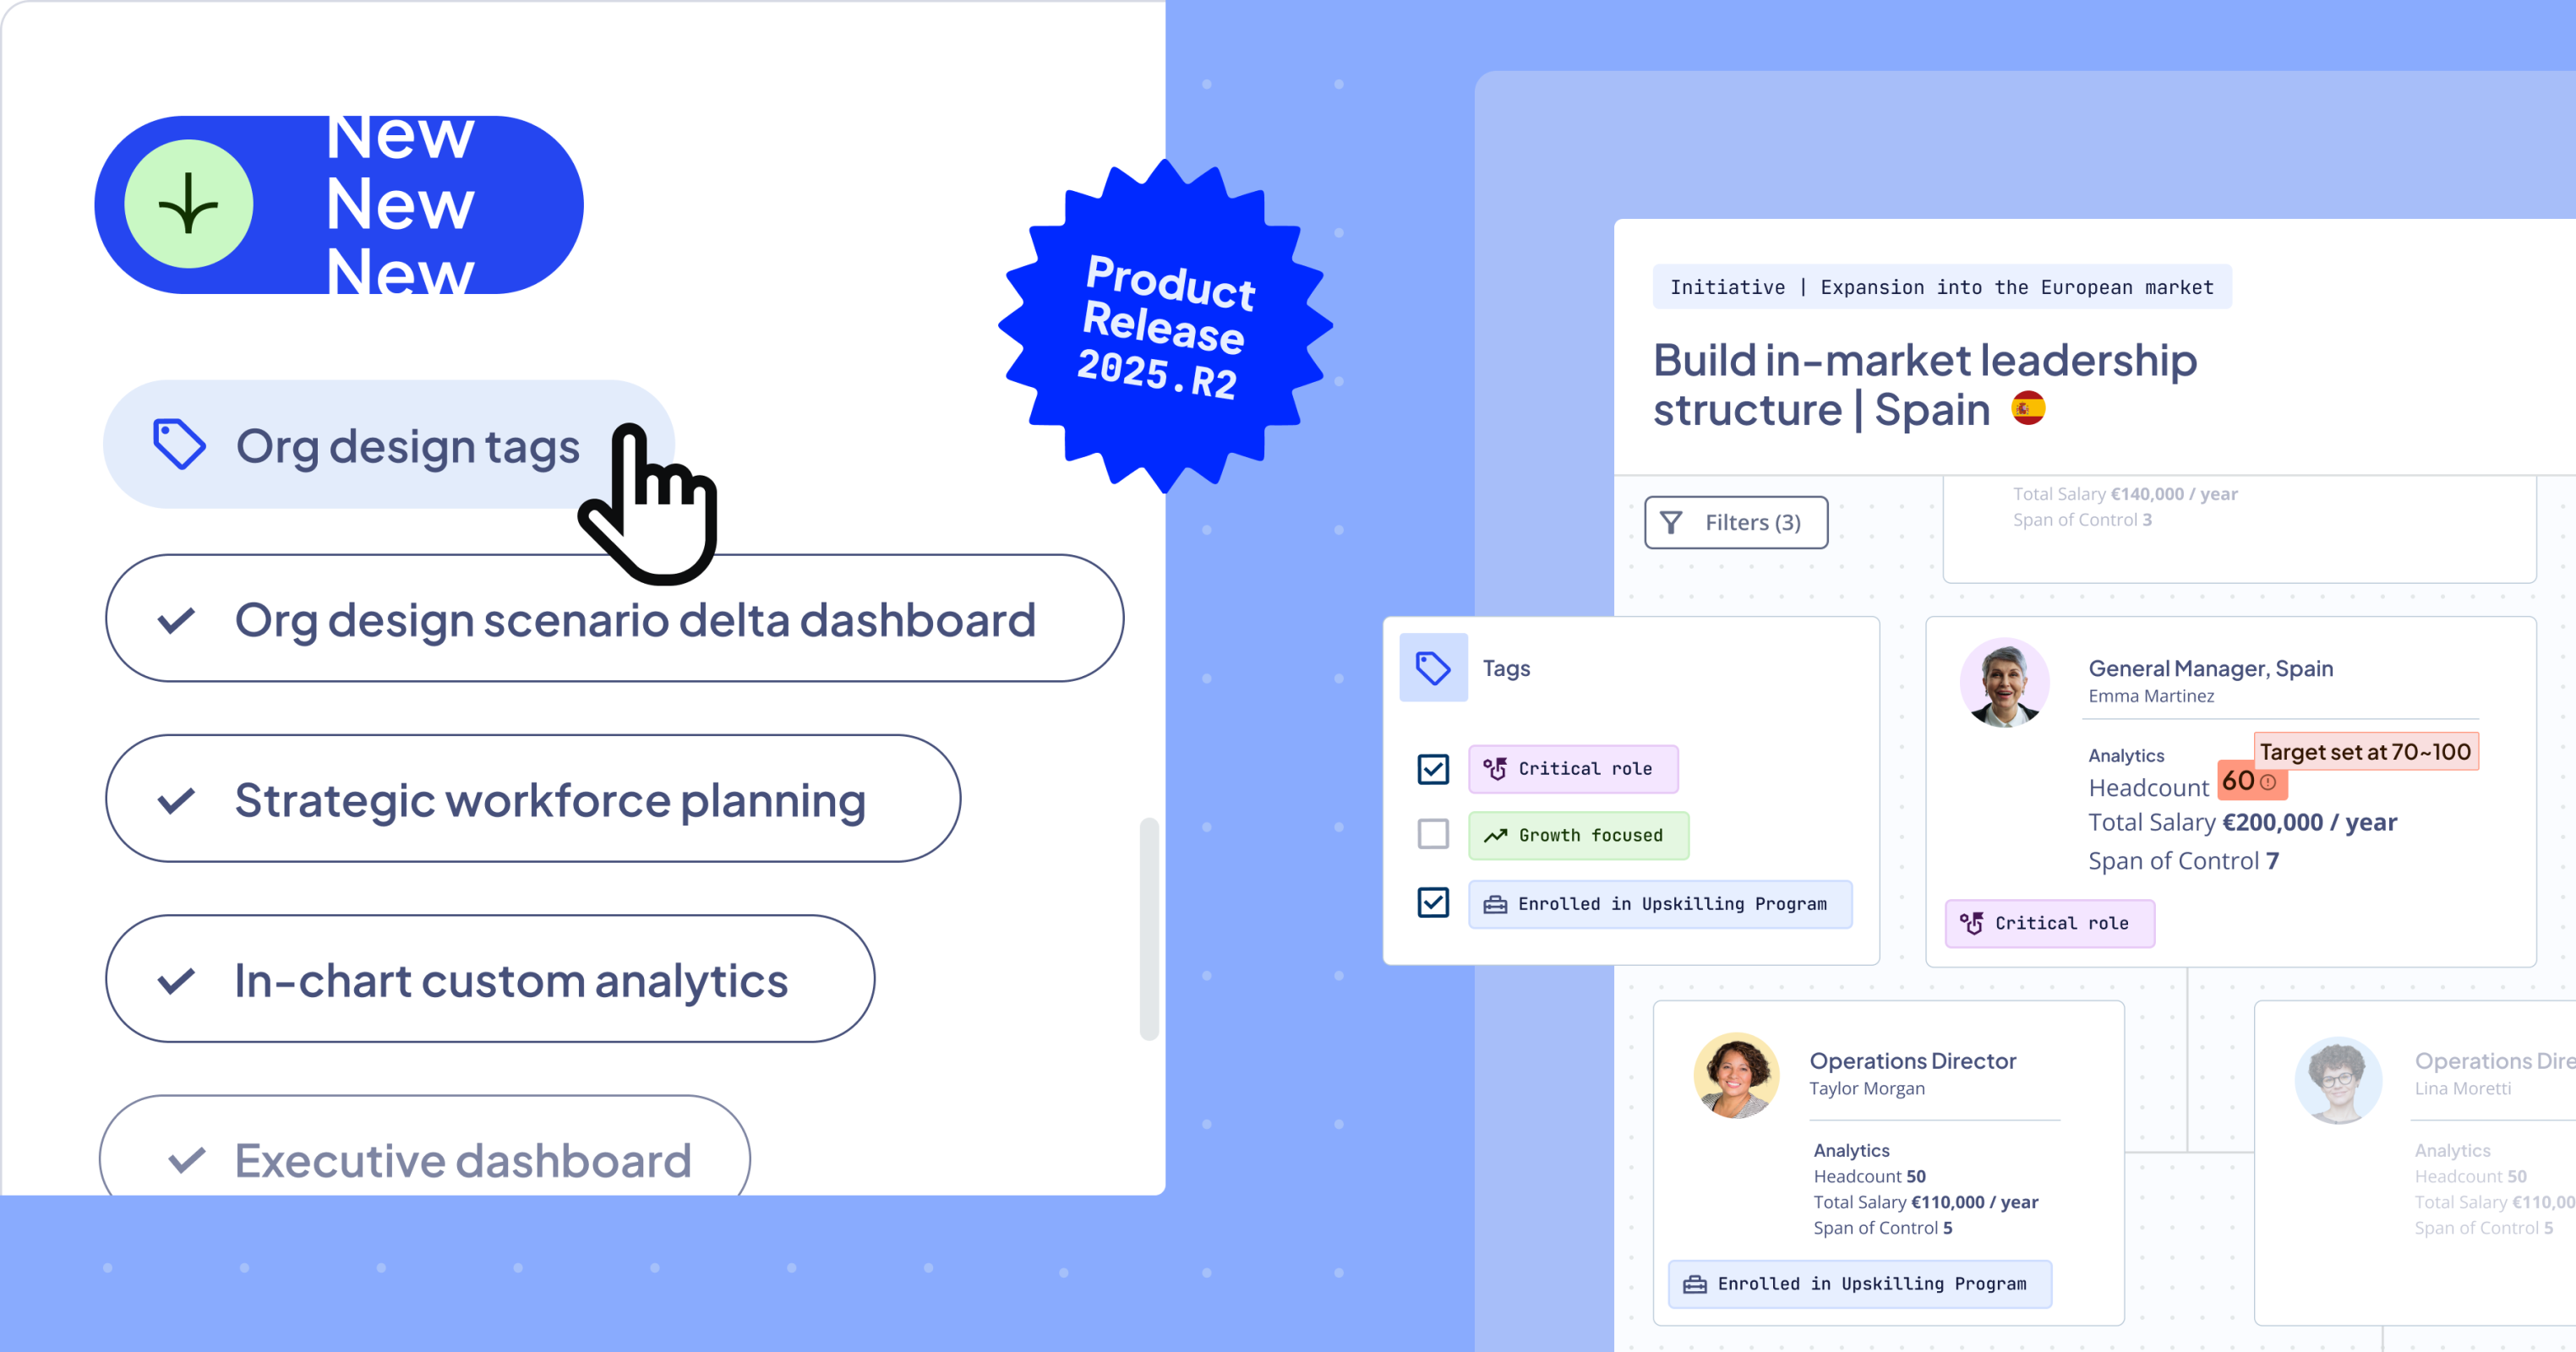
2.2 Flexible tagging and filtering for scenario planning: better structure and focus
Tagging is a simple yet powerful feature that brings structure and focus to your org design process. You can create tags on the fly, give them meaningful names (e.g., Critical role, Under review), assign a color for better visibility, apply them to any position in your org chart, and filter by tags to enhance your org design workflow. There’s no limit to the number of tags you can create, and each one can be applied to any position relevant to your scenario.
This feature is especially useful in use cases such as marking roles for repurposing or reduction during a reorganization, flagging critical roles that need to be reviewed or retained, grouping roles for team moves or future hiring plans, or tracking positions under evaluation in a collaborative org design effort.
To focus on specific tagged roles, simply filter by the tags you want to highlight, everything else will dim out, helping you zero in on the positions that matter most to your design. Tags support better collaboration, enable quick filtering for insights, and help you make data-driven decisions with faster and with greater confidence.

2.3 Scenario targets and delta analytics: data-driven org design
Setting targets and tracking progress is key to staying aligned with your organizational goals. With built-in analytics and delta views, you can define key metrics for your scenario, such as maximum headcount or acceptable span of control, and monitor how changes affect your targets in real time.
You can set targets directly from the org chart. For example, if a manager’s span of control exceeds the acceptable range, simply right-click the position, select “Set Target,” choose the relevant metric, and define upper and lower bounds. Once saved, visual indicators appear on the chart to show whether the metric is within range. As you make structural changes, like moving positions to balance teams or optimize reporting lines, the analytics automatically update. The Delta column highlights the impact of each change, showing how metrics like span of control or total salary shift from their original state.
This feature helps you continuously measure progress, stay on track, and make informed, data-driven decisions throughout your org design process.

2.4 Delta dashboards for before-and-after analysis: data-driven org design
Delta dashboards allow you to measure the true impact of your org design by comparing key metrics before and after structural changes. For example, you can create charts that measure the number of vacant positions before and after the reorganization or compare total salaries to assess the financial impact. You can also add charts that illustrate key structural shifts, such as changes in the number of managers with subordinates or variations in span of control per manager.
These visual insights help validate decisions, communicate outcomes clearly, and ensure alignment with your strategic goals. Once all your charts are in place, you’ll have a fully built dashboard that captures the before-and-after state of your organization, empowering faster, more confident decision-making.

2.5 Enhanced change report and advanced export: transparent org design delivery
Tracking changes throughout your scenario is essential for governance and communication. The change report provides a clear summary of all edits, deletions, and movements, highlighting exactly what was modified, with both the old and new values for easy comparison. We’ve enhanced the change report to improve readability and export. You can download it as a CSV or Excel file to review, share, or prepare for implementation, giving stakeholders a detailed, transparent record of all.
Once your design is finalized, the advanced export feature lets you capture a static snapshot of your org chart. The export includes only what’s currently visible on your screen, such as a specific level or department, rather than the full org structure. By default, the change info overlay is hidden in the snapshot. When enabled, it highlights all modifications, including created, updated, deleted, or moved positions. This functionality is also available in the Operational Org Design product.
Together, the change report and advanced export features equip you with the clarity and documentation you need to finalize and communicate your org design scenario effectively.
2.6 Additional functionalities to further streamline your strategic org design processes
The latest release includes additional enhancements to the Strategic Org Design, such as:
- Detailed employee and position pages
Clicking on a position box opens the quick details panel directly within the scenario, just like in the org chart, providing a fast way to view essential information. Users can also access full detail pages for both positions and employees to explore more comprehensive data. - Intuitive search within org design
Scenario search is now available, enabling users to look up specific positions, employees, or changes using the same functionality as in the org chart, saving time and reducing complexity. - In-chart analytics: Instant feedback as you plan
With In-chart analytics, you can see real-time updates to key metrics, such as headcount, cost, and span of control, directly within the org chart as you make changes. Whether you're adding new roles, shifting reporting lines, or refining your structure, the impact is immediately visible. This gives you the clarity to understand how each decision affects your organizational goals, without ever leaving the chart. Perfect for faster, more informed planning sessions. - New roles for improved collaboration and control
Three roles have been introduced—creator (full access), collaborator (read or write access), and approver (view, approve, or reject)—to ensure clear access control and streamlined collaboration throughout the process.
Start using these functionalities in Nakisa
To get access to our Org Design product, please reach out to your dedicated Nakisa Client Success Manager or contact us here.
3. Workforce Planning Suite enhancements: introducing Nakisa Strategic Workforce Planning
This release brings major enhancements to the Workforce Planning Suite, introducing our newest product, currently in active co-development and final stages of delivery: Nakisa Strategic Workforce Planning. Designed for large organizations with dynamic workforce needs, this product empowers you to make data-driven decisions, ensuring your workforce skills and resources align with mid- and long-term initiatives.
At the core of Nakisa Strategic Workforce Planning is a guided workflow structured around six key steps:
- Time horizon and cluster selection: Define the planning timeline (short, medium, or long-term) and select relevant organizational dimensions such as departments, job families, or regions.
- Current state assessment: Evaluate current workforce using the 5C framework to ensure your organization is not only staffed appropriately, but also structured, skilled, and financially aligned to achieve your strategic objectives:
- Capacity measures the organization’s ability to meet business demands with available talent, assessing headcount, workload, and productivity to identify where more resources are needed or where optimization is possible.
- Cost evaluates salaries, compensation, recruitment, onboarding, training, and related workforce investment to align talent strategy with budgets.
- Capabilities analyze skills and competencies at both employee and position levels to identify gaps, support upskilling, and build adaptability.
- Composition examines workforce structure and diversity, including roles, functions, seniority, demographics, and employment types, to ensure the right mix of talent to meet goals.
- Configuration looks at how the workforce is organized, including organizational structure, geography, span of control, and layers, to optimize collaboration and responsiveness.
- Future state driver configuration: Identify key drivers that shape future workforce projections, such as:
- Supply: internal factors like attrition rates and retirements
- Market: external factors like unemployment rates and inflation
- Demand: internal factors like revenue growth targets, geographical expansion, and operational goals
- Gap analysis: Compare current and future workforce states to identify gaps and risks across the 5C categories.
- Scenario creation and selection: Develop and evaluate multiple workforce scenarios to close the supply/demand gap using the 6B model. Analyze and select the most appropriate combination of “B” strategies to meet your business objectives effectively:
- Buy: Recruit new talent
- Borrow: Hire contractors
- Bot: Automate certain roles
- Build: Upskill or train existing employees
- Bounce: Reduce or transition certain roles
- Bind: Retain key talent
- Ongoing scenario tracking: Once implemented, monitor selected scenarios over time and adjust plans based on outcomes. At this stage, based on your internal processes, you can begin operational or strategic organizational design and operational workforce planning.
Start using this functionality in Nakisa
The development of the Strategic Workforce Planning is ongoing in collaboration with selected co-innovation partners. If you are interested in participating or learning more, reach out to your dedicated Nakisa Client Success Manager or contact us here.
4. Portfolio-wide enhancements
In addition to the suite-specific upgrades outlined above, we’ve introduced powerful portfolio-wide enhancements designed to elevate the user experience, streamline workflows, and strengthen cross-suite alignment across the Workforce Planning Portfolio.
4.1 Nakisa Al Assistant available to all users across Nakisa products
This powerful AI assistant is now available to all users upon login to any Nakisa solution. Users can find Nakisa AI Assistant directly from Nakisa Product Center, where they can ask questions about how to use any feature, regardless of suite, as well as make queries about organizational design, advanced analytics, and other domain-specific information that may help them with their overall work.
Powered by Generative AI and Retrieval-Augmented Generation (RAG), Nakisa AI Assistant delivers intelligent, context-aware support. It’s trained exclusively on our extensive documentation library to provide accurate, relevant responses and enhance the user experience across all Nakisa products. Important: Nakisa AI Assistant is never trained on your organization’s data. It relies solely on Nakisa’s documentation library. Learn more about our AI security approach.

Access intelligent, context-aware support from Nakisa AI Assistant with just a simple prompt.
4.2 Enhanced data handling and error messaging: greater system resilience and user experience
Your experience is now more resilient and reliable thanks to enhanced data handling and error messaging improvements. Stricter data validation checks for null values in key relationships, preventing crashes caused by missing or malformed data. The system also handles invalid reporting structures more gracefully. For example, if a person is incorrectly assigned multiple direct (solid line) managers, only the first one found will be displayed to avoid confusion. Circular reporting chains are automatically detected and managed.
When issues are found, Admins see clear, contextual messages explaining the problem and can generate reports to review the Data Quality Console. From there, they can either run a basic or full report to identify the source of the problem. This enables corrective action directly in the ERP system, ensuring that the fix is reflected in the next data sync.
Regular users won’t see these alerts and can continue navigating the org chart seamlessly, though a specific error caption may appear on certain boxes if data problems are present. Additionally, backend 500 errors now trigger a single clean notification instead of multiple pop-ups.
These enhancements reduce disruptions from bad data, improve org chart stability, and deliver a smoother, more predictable experience, especially in complex organizational structures.

4.3 Easier access to key pages and documents from the Product Center
Users can now save even more time using Nakisa Product Center as a central hub to track recent activity and quickly access their favorite capabilities. Favorites and recent items are now accessible directly within the Product Center Details panel, making it easier to return to frequently used products and interactions, enhancing overall efficiency.

Nakisa Product Center helps users save even more time by serving as a central hub for tracking recent activity and accessing favorite capabilities.
Users can also upload and manage documents or external links in Nakisa Product Center, a central hub where they can store resources for personal use or share them with others in a single click.
Start using these functionalities in Nakisa
Nakisa AI Assistant, along with the recent and favourites features and document/external link upload, are portfolio-wide updates and are automatically enabled for all users. Simply log in to the Nakisa portal to start using these tools. The Data quality validation tool is only available to Admins.
4.4 Nakisa Product Suggestions: a direct way to shape Nakisa’s roadmap
We’re excited to introduce Nakisa Product Suggestions, a faster and more transparent way for clients to influence our product roadmap. As part of our product-led initiative, this new process allows you to submit feature ideas and enhancement requests directly to our product teams, without going through support. Suggestions are sent straight to the leaders of our Workforce Planning, Accounting, and IWMS and product portfolios, ensuring they reach the right decision-makers.
This approach streamlines feedback, reduces turnaround time, and gives you a more active role in shaping Nakisa’s future. It reflects our commitment to building better products through close collaboration and real-world insights.

Start using this functionality in Nakisa
You can now submit feature ideas and enhancement requests directly through Nakisa Customer Support Portal. Just select the new option: Submit Nakisa Product Suggestion (Cloud Customers).
Log in to Nakisa Customer Support Portal (ask your CSM if you need access). Choose New Feature or Feature Enhancement and fill out the short form. Describe your use case and pain points. Attach mockups or documents if needed. Track your suggestion in the portal after submission.
Disclaimer: Submission does not guarantee implementation. All suggestions are reviewed and prioritized by the Nakisa Product Team, but there is no commitment to include them in an upcoming release.
5. Conclusion
With these latest enhancements, Nakisa continues to raise the bar for organizational clarity, strategic flexibility, and actionable workforce insights.
Want to see how these purpose-built capabilities can support your organization? Get a personalized demo and discover how Nakisa can help you confidently plan your workforce and design your organization for today and tomorrow.
Interested in co-innovating the Nakisa Strategic Workforce Planning product with us? Reach out to your dedicated Nakisa Client Success Manager or contact us here.
Stay in the loop. Subscribe to our monthly newsletter to receive product updates, expert insights, and best practices, delivered straight to your inbox.