Why is HR data integrity important?
For large enterprises, HR data integrity is a critical strategic and operational imperative. According to research by Gartner, poor HR data quality leads to losses of $12.9 million per year. When HR data contains inconsistencies, whether in reporting structures, compensation metrics, or talent profiles, the consequences cascade across the entire organization:
- Flawed strategic decisions: Workforce optimization, succession planning, and transformation initiatives built on bad data lead to poor results.
- Operational inefficiencies: Data inconsistencies multiply across business units, creating delays, manual reconciliation, and rework.
- Compliance and legal risks: Inaccurate data, especially in multinational environments, jeopardizes adherence to labor laws and reporting requirements.
- Wasted resources: Teams spend time fixing data issues instead of focusing on higher-value, strategic work.
Maintaining high-quality, reliable HR data is foundational to resilient planning, effective risk management, and confident, data-driven decisions that drive enterprise growth.
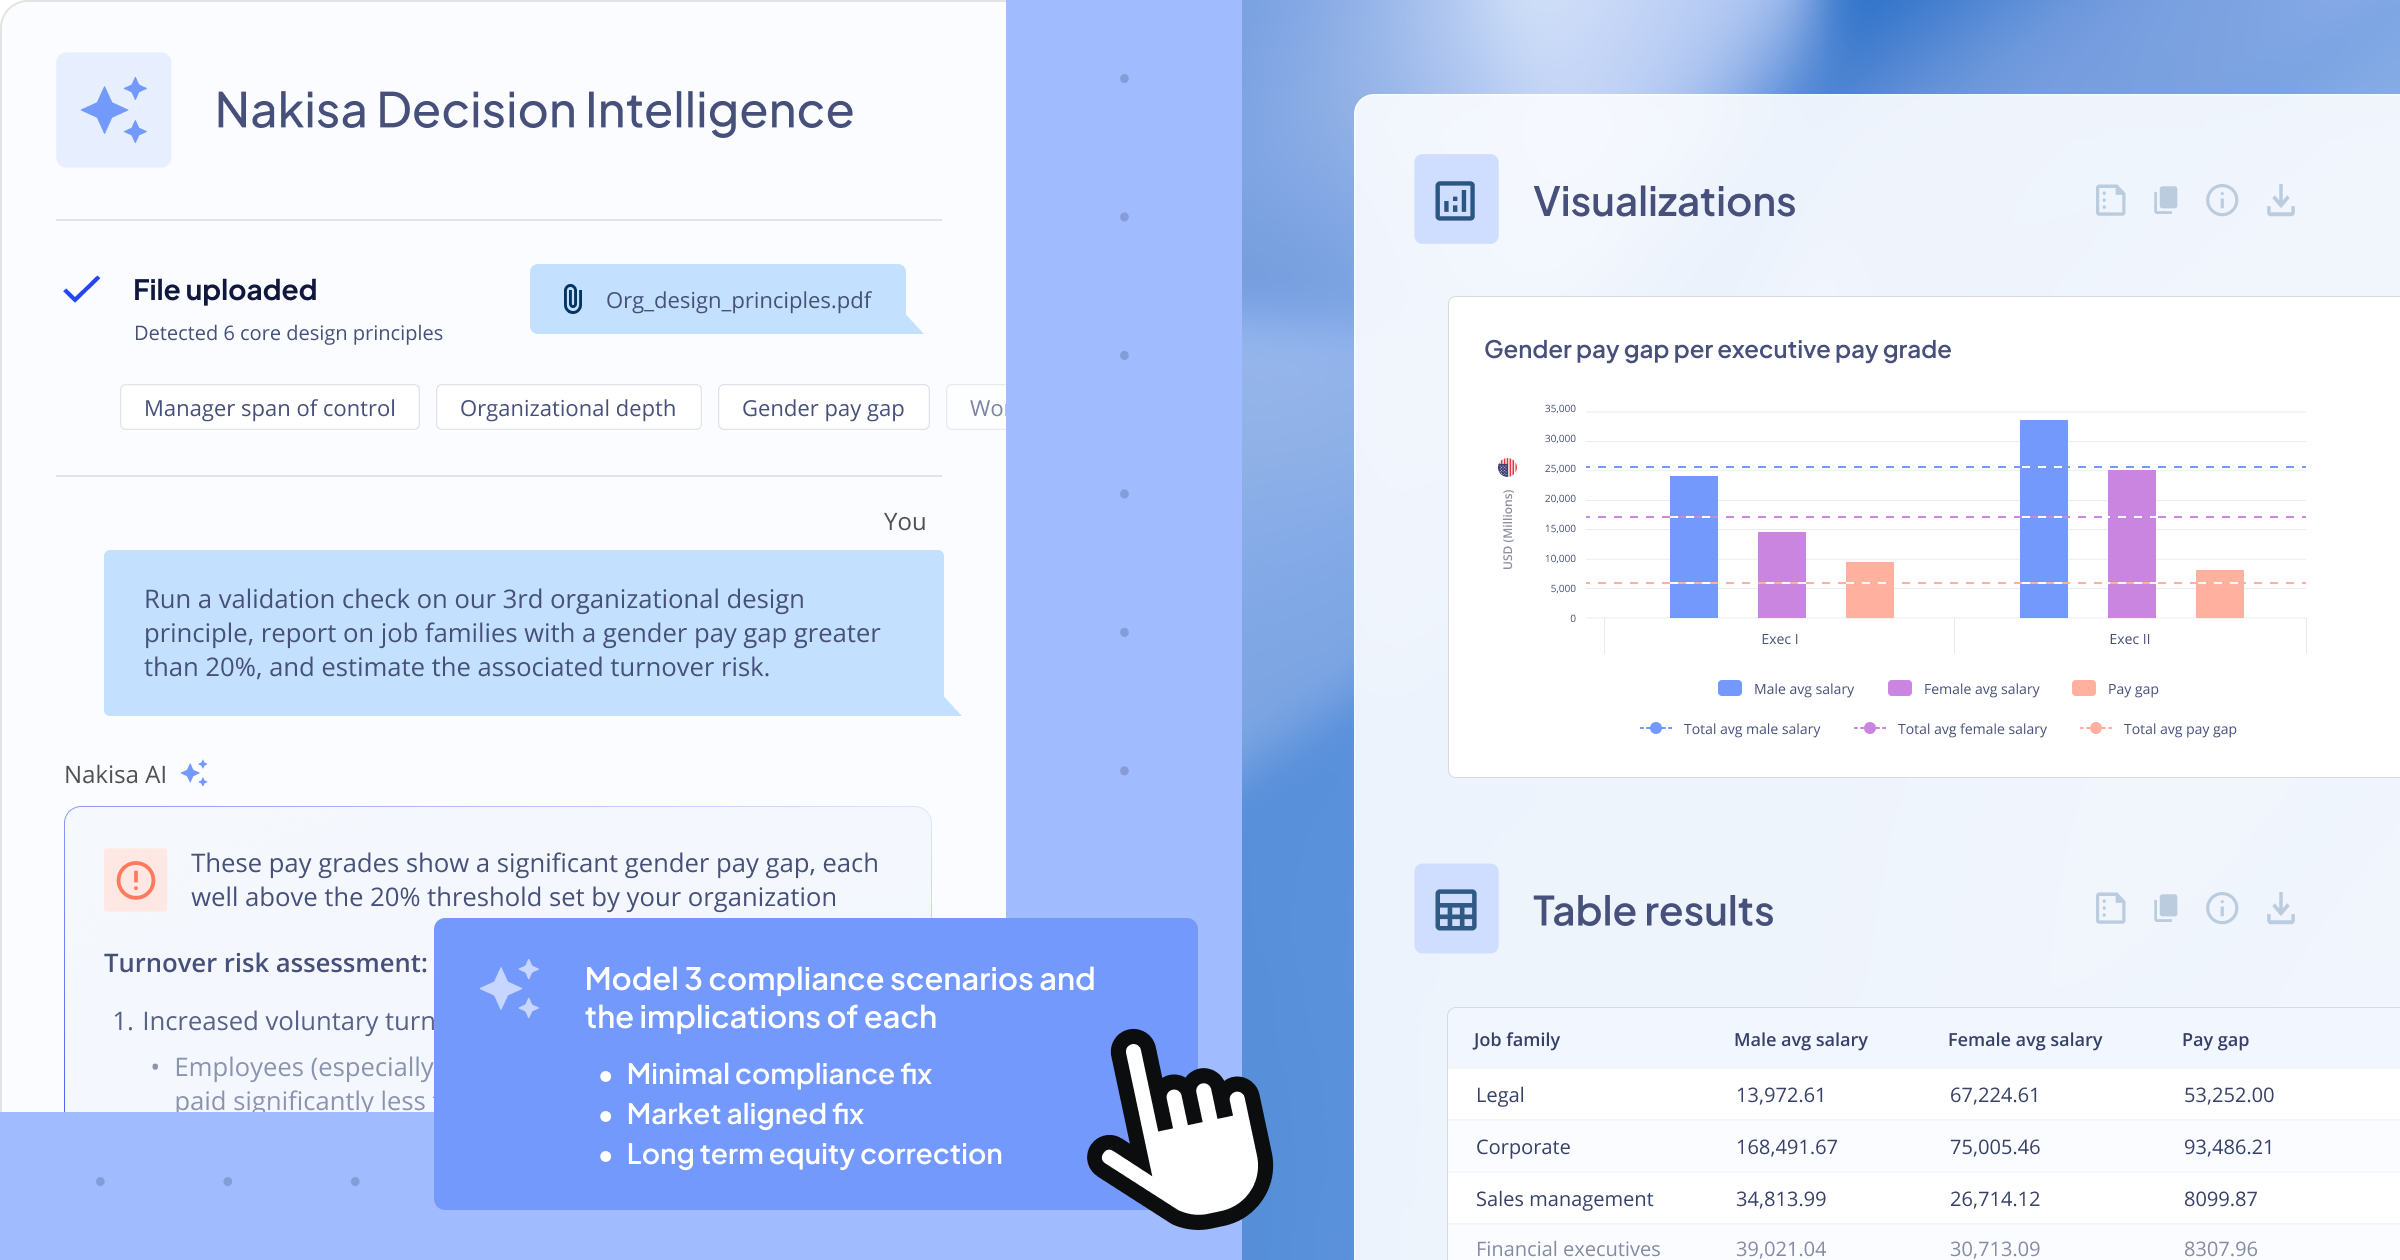
How to validate HR data integrity: demo of Nakisa Decision Intelligence (NDI)
We've seen why HR data integrity is critical for large enterprises. Now let's look at how Nakisa Decision Intelligence (NDI) makes data quality validation fast and intuitive.
In this walkthrough, we use simple conversational prompts to assess HR data, surface inconsistencies, and generate an actionable remediation plan, all in just a few minutes.
You can also watch the full video demonstration below:

Understanding your data quality rules
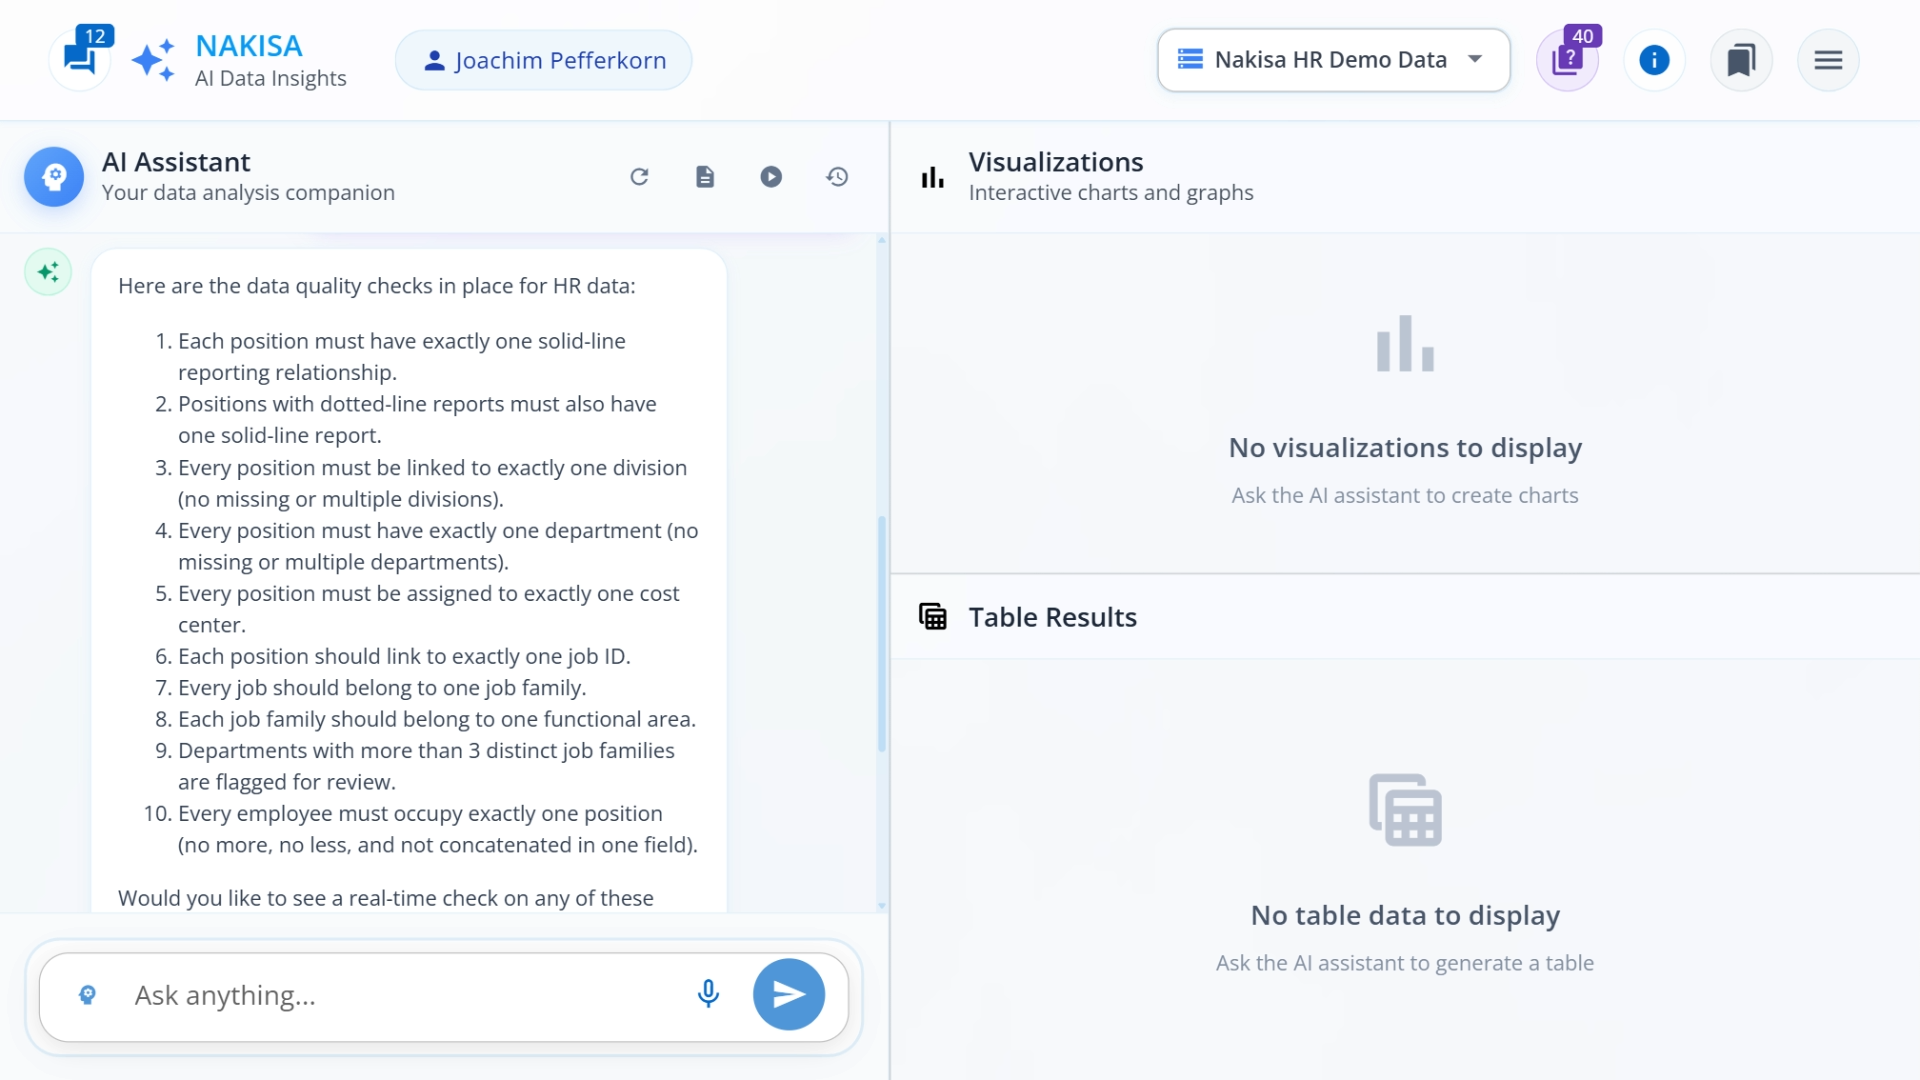
The first step in any data quality assessment is understanding the standards you're working with. We begin by asking NDI to display our organization's internal HR data quality rules currently in place.
Prompt: “What are the data quality checks we have in place?”
The platform responds with a clear, bullet-point list of our different rule sets, making it easy to see what guidelines govern our data. NDI also suggests relevant follow-up questions to help guide our analysis.
Calculating your Structural Data Quality Index
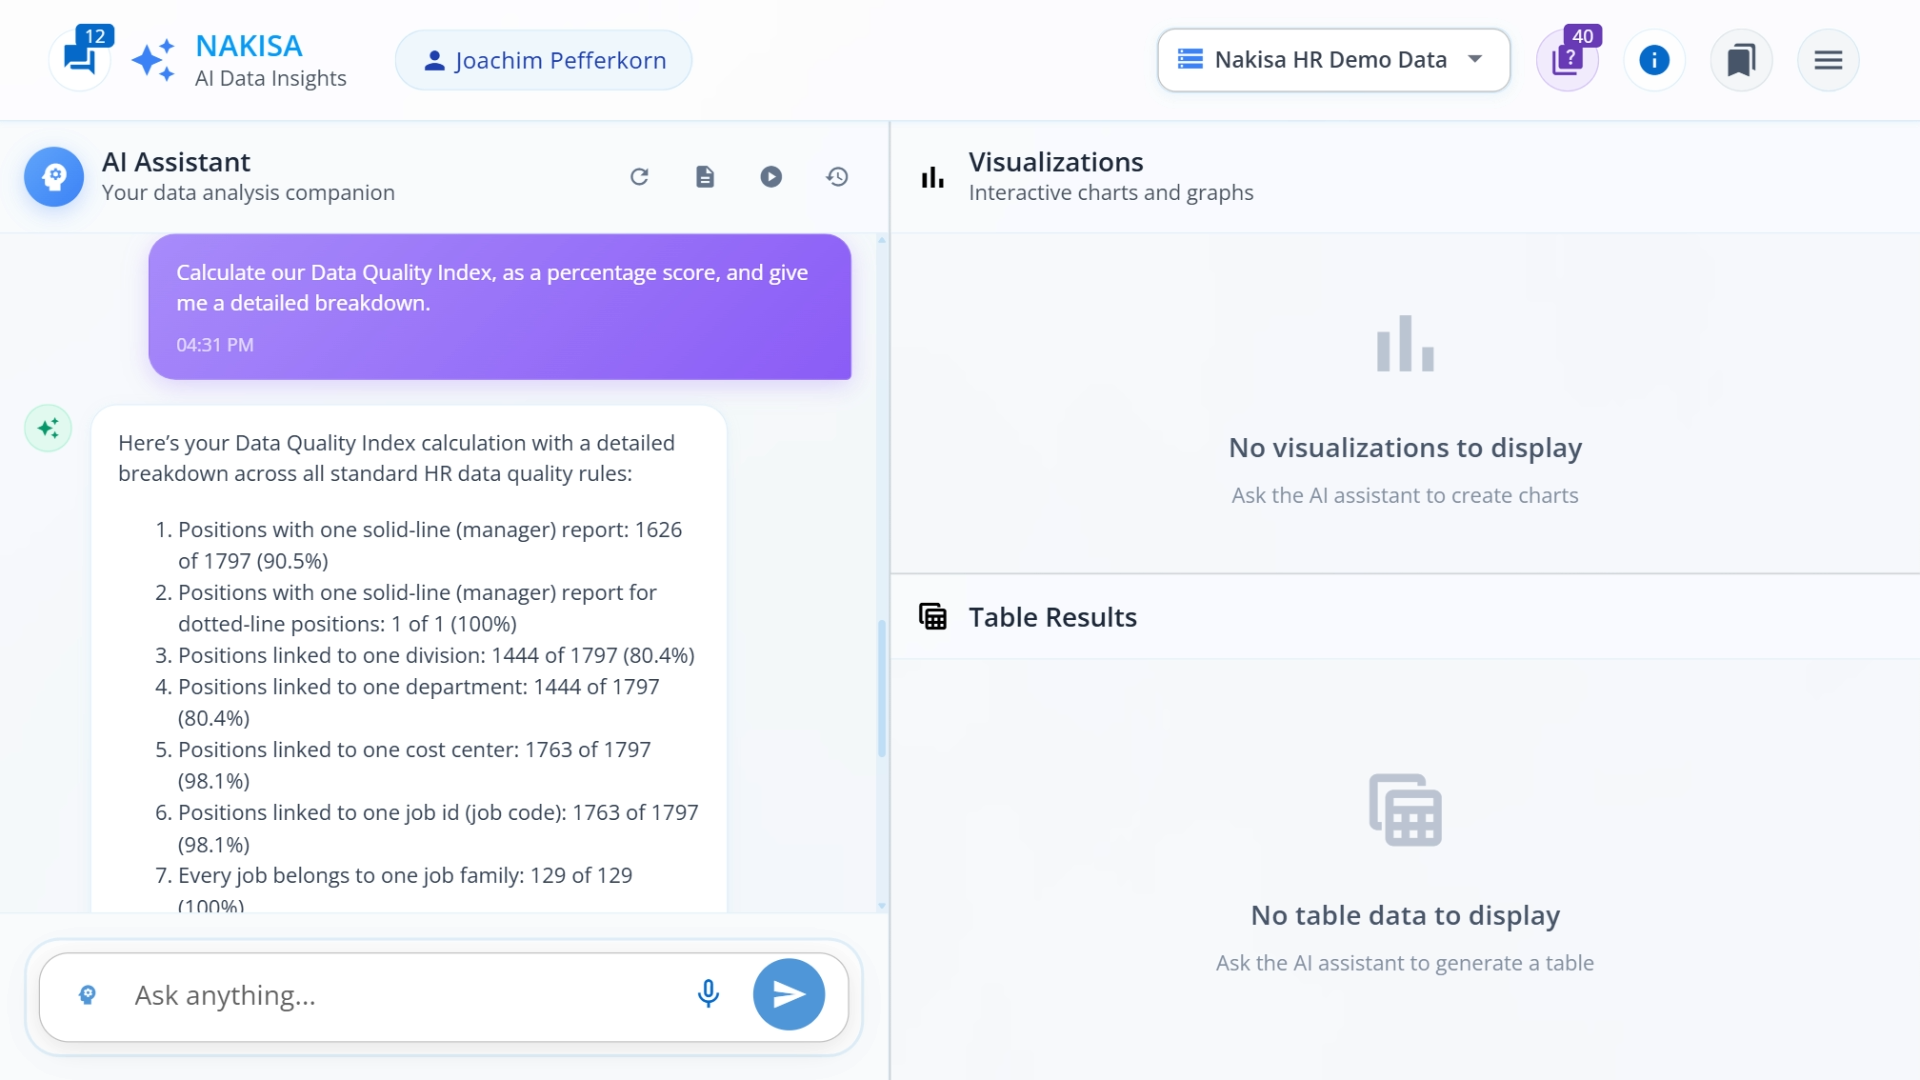
Rather than manually reviewing each rule, we can ask NDI to calculate an overall Data Quality Index for us. This gives us a quick snapshot of how well our current data aligns with our established standards.
Prompt: “Calculate our Data Quality Index, as a percentage score, and provide a detailed breakdown.”
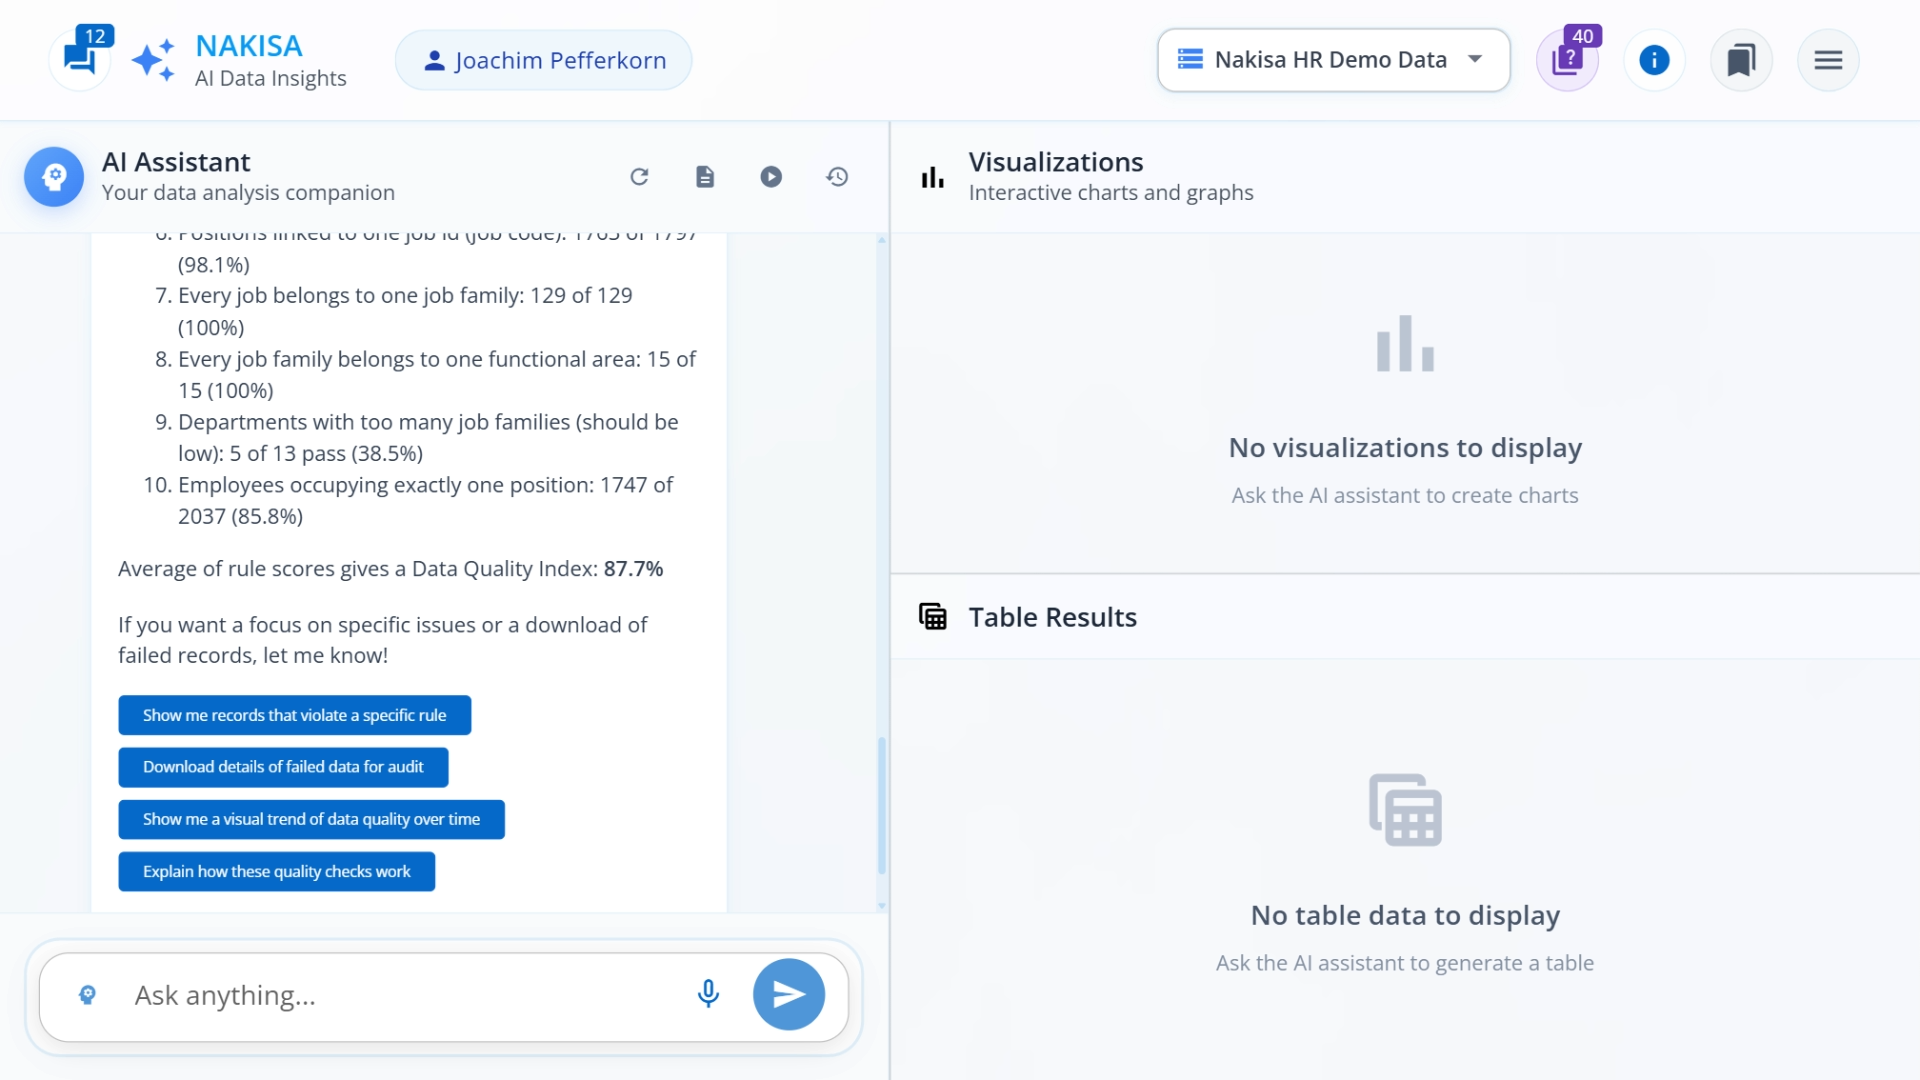
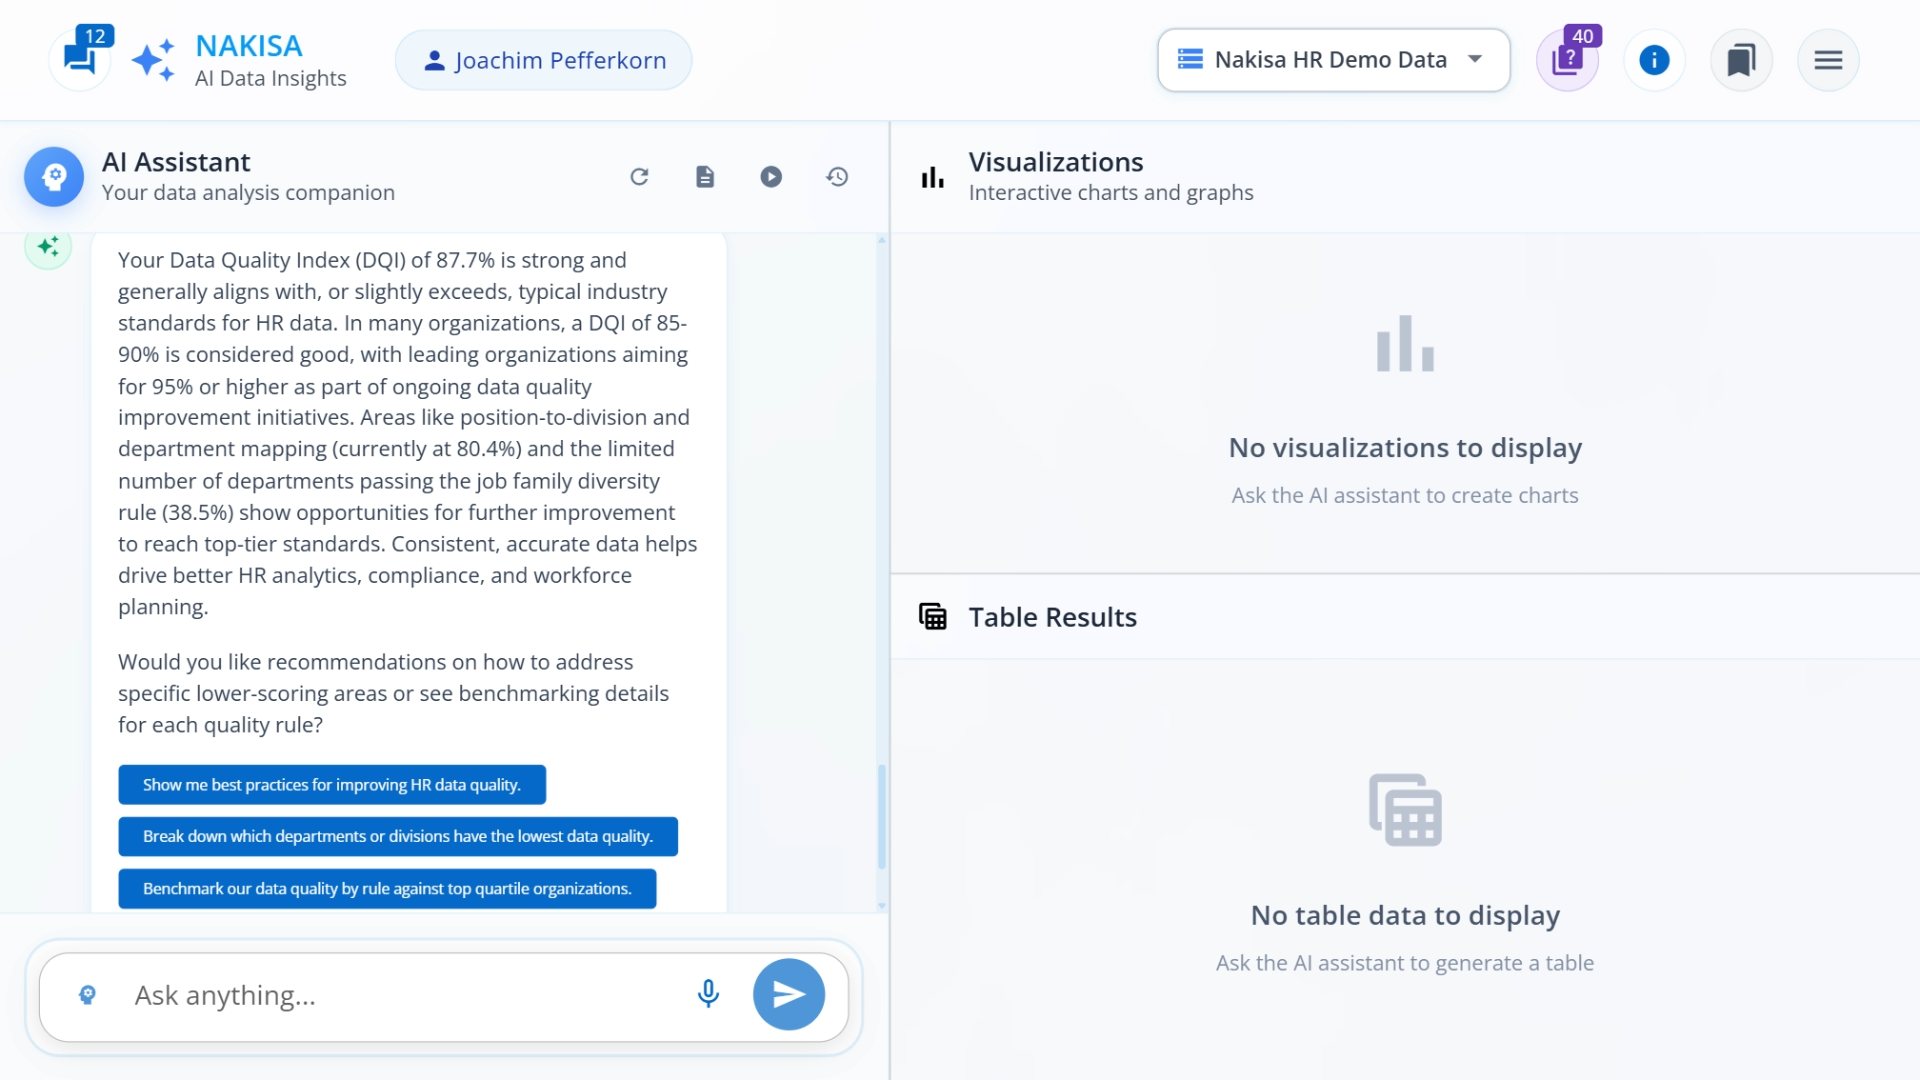
NDI analyzes every rule we've set and calculates compliance scores for each one. The results show a breakdown per rule, with a final total score of 87.7%, a solid baseline, but with clear room for improvement in specific areas.
Benchmarking against industry standards
Context matters when evaluating data quality, so we prompt the system to compare our organization's index with industry standards.
Prompt: “How does this compare to industry standards for HR?”
Good news: our 87.7% score aligns well with the typical 85–90% benchmark for HR data quality. However, the analysis reveals that certain rules have significantly lower scores, representing concrete opportunities for improvement.
Drilling down into problem areas
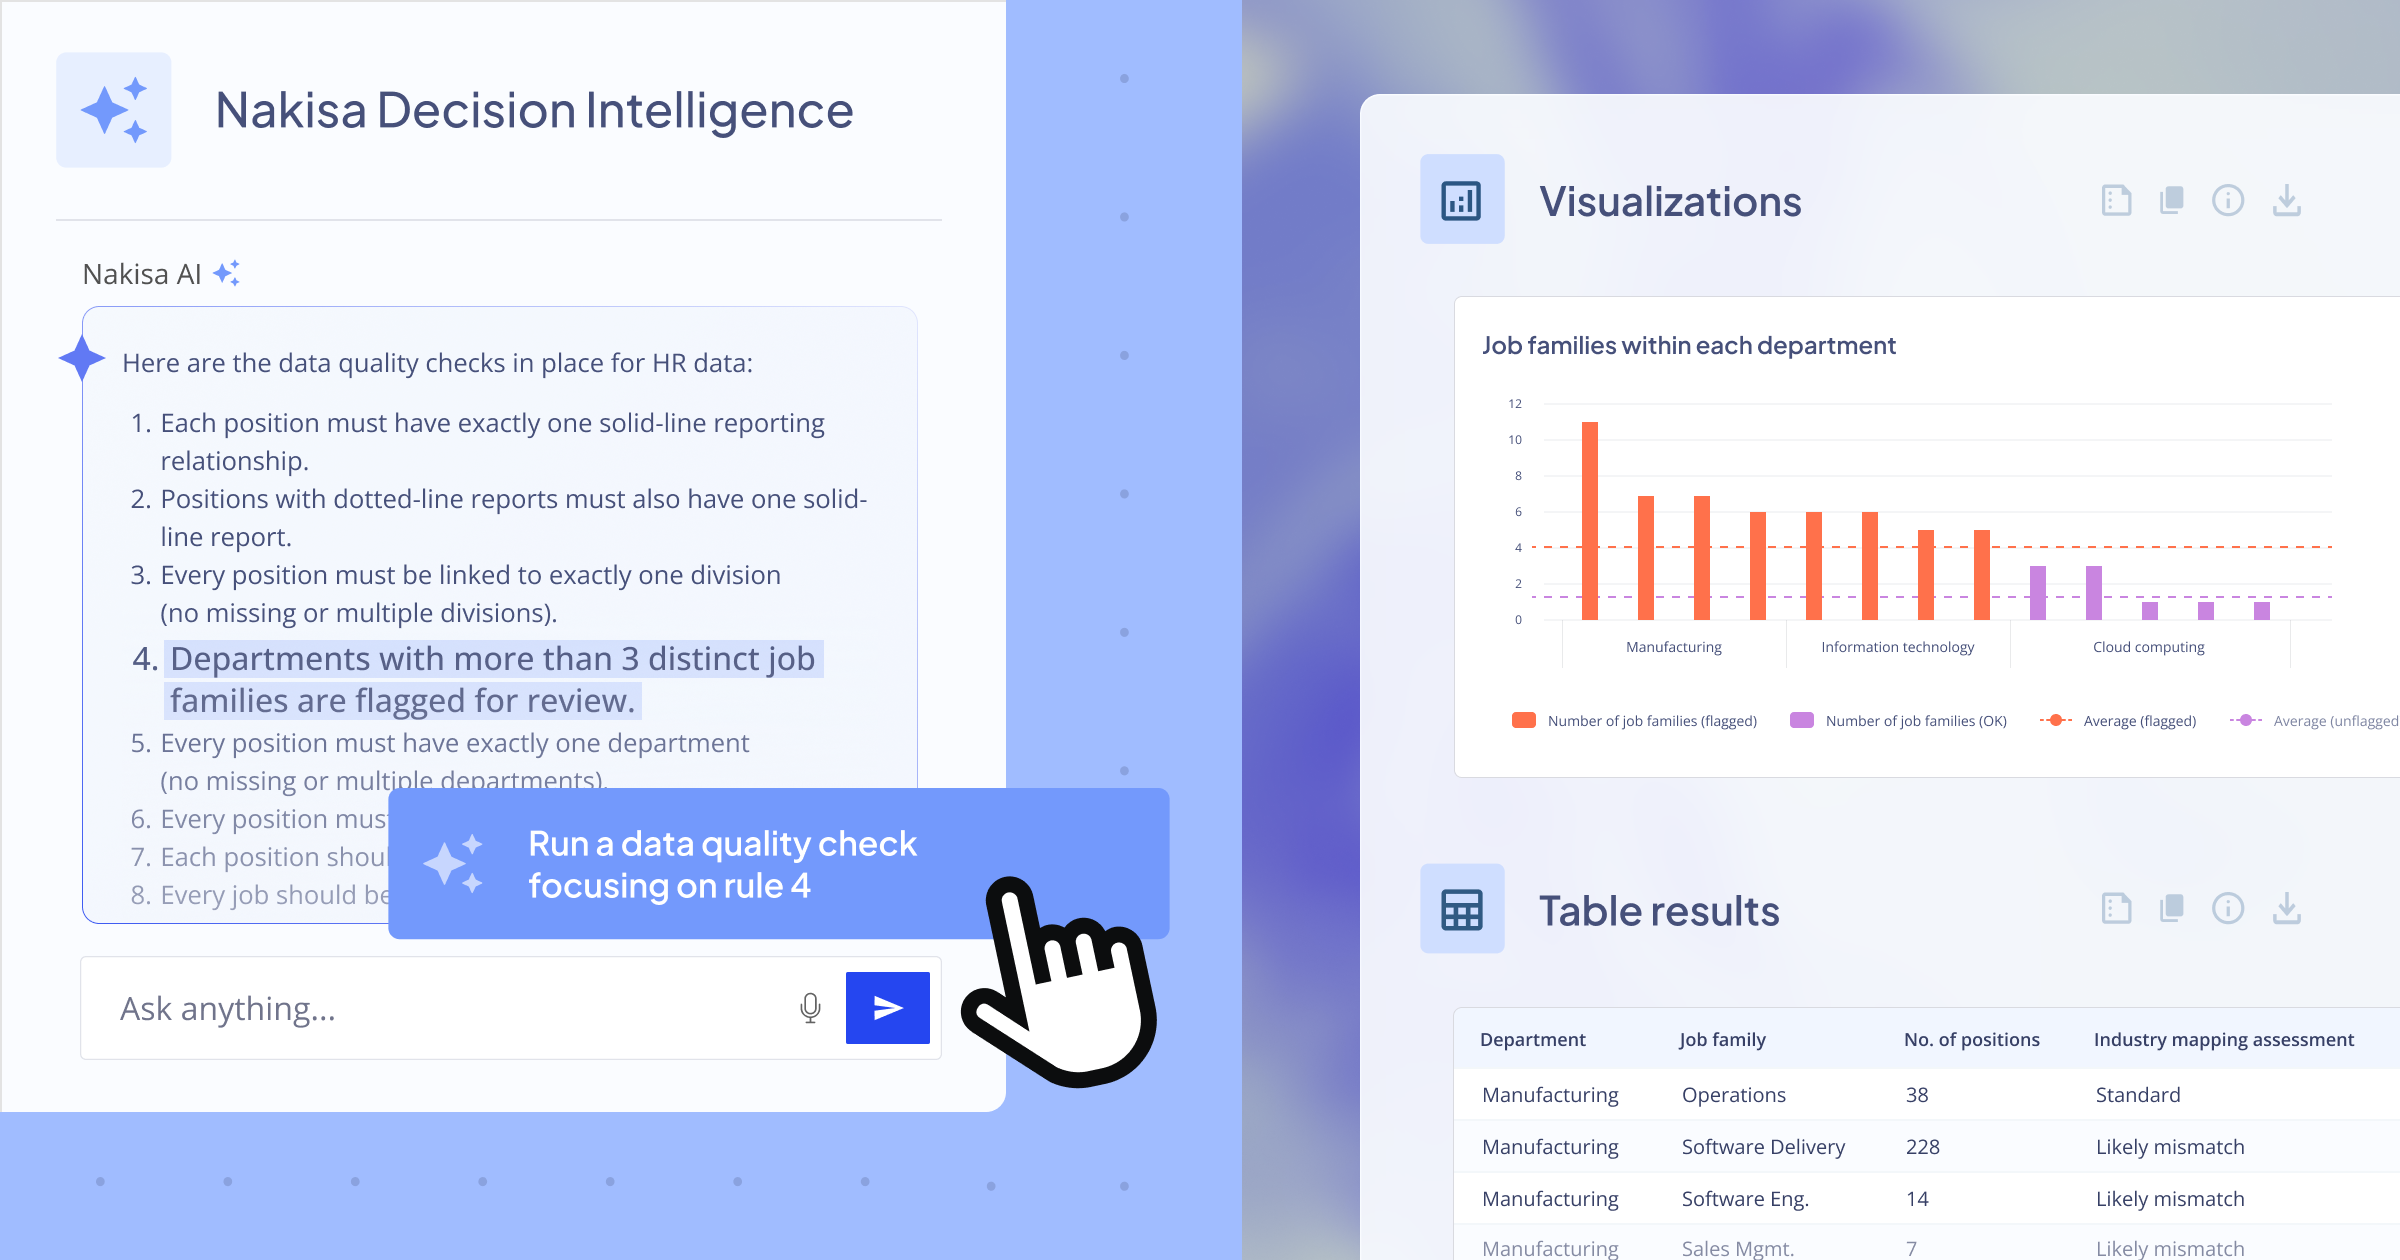
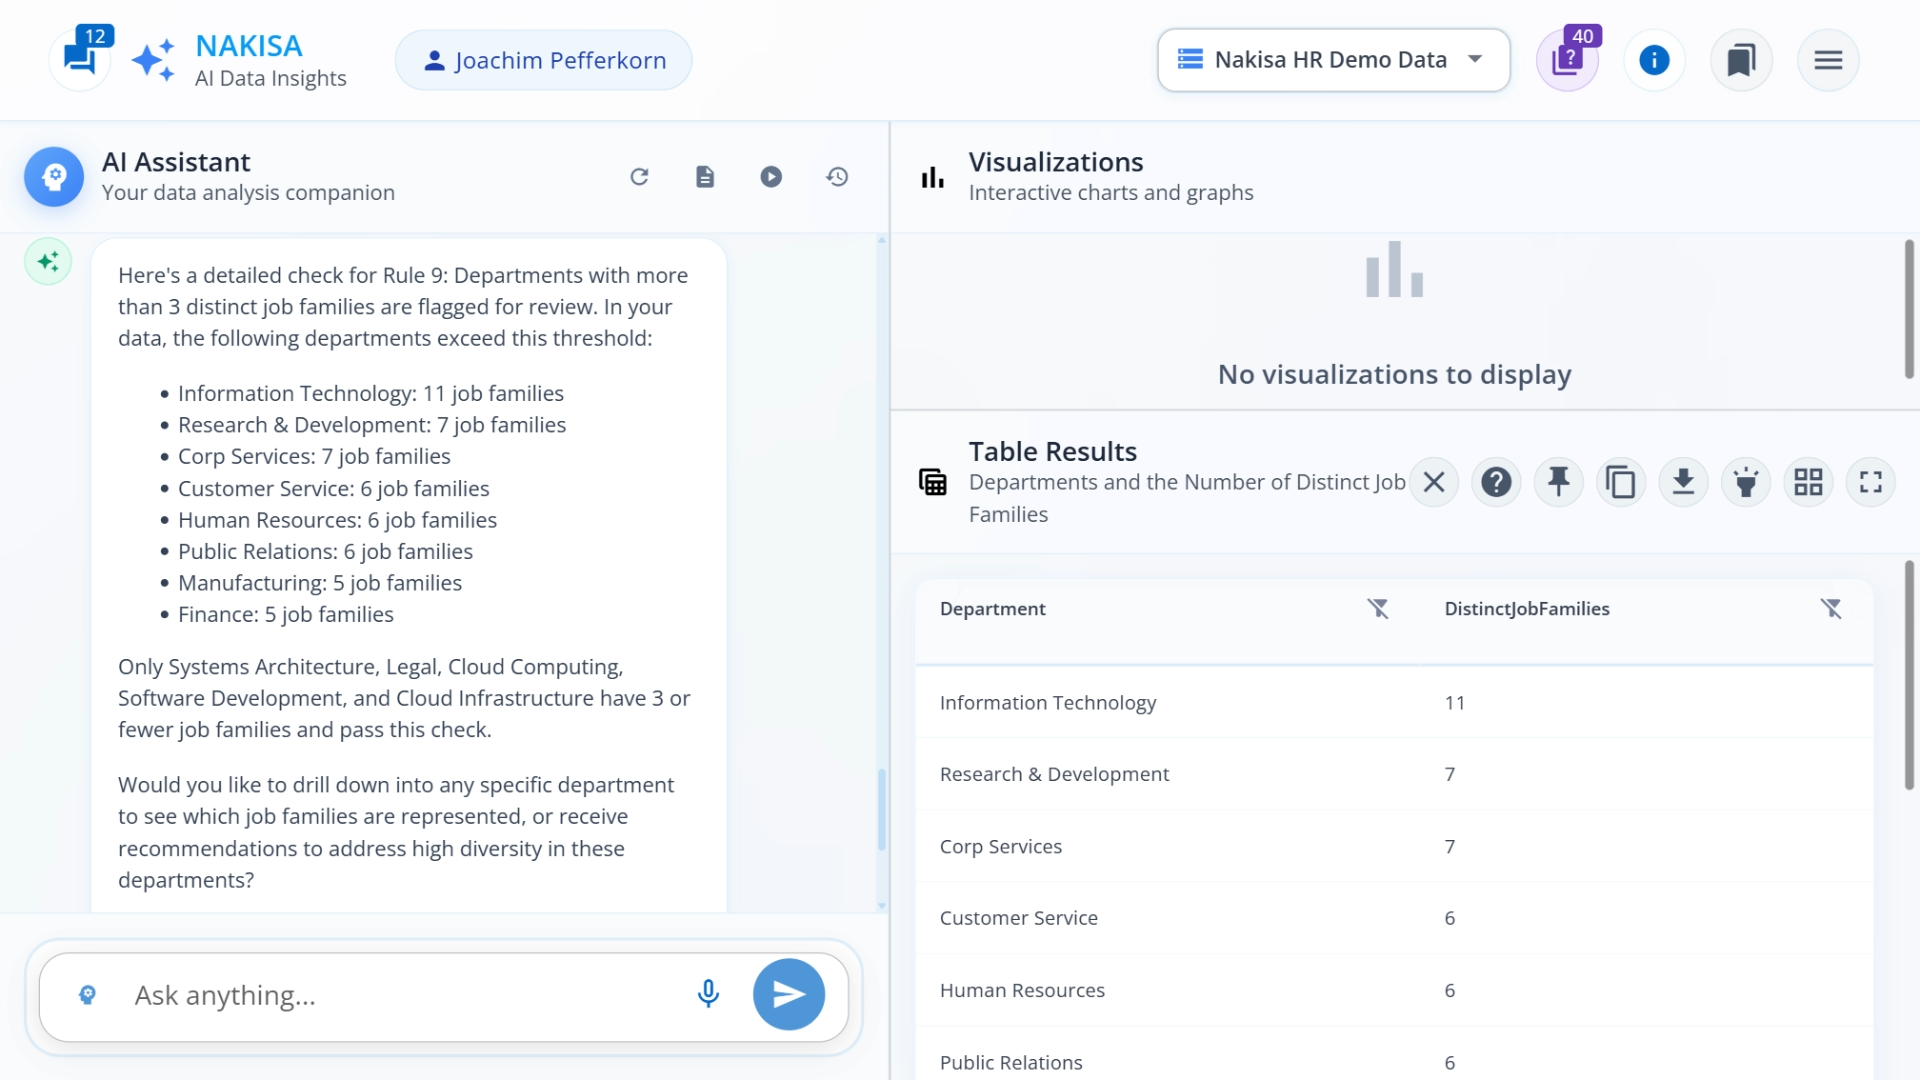
One rule in particular stands out: Rule 9, concerning department and job family diversity, scored only 38.5%. This warrants a closer look, so we ask NDI to focus specifically on this rule.
Prompt: “Can you run the data quality check focusing on rule 9?”
The system immediately visualizes every department with more than three distinct job families. The results appear both in the chat interface and as a detailed, downloadable table on the right side of the screen, which is perfect for further analysis or sharing with stakeholders.
Visualizing the data
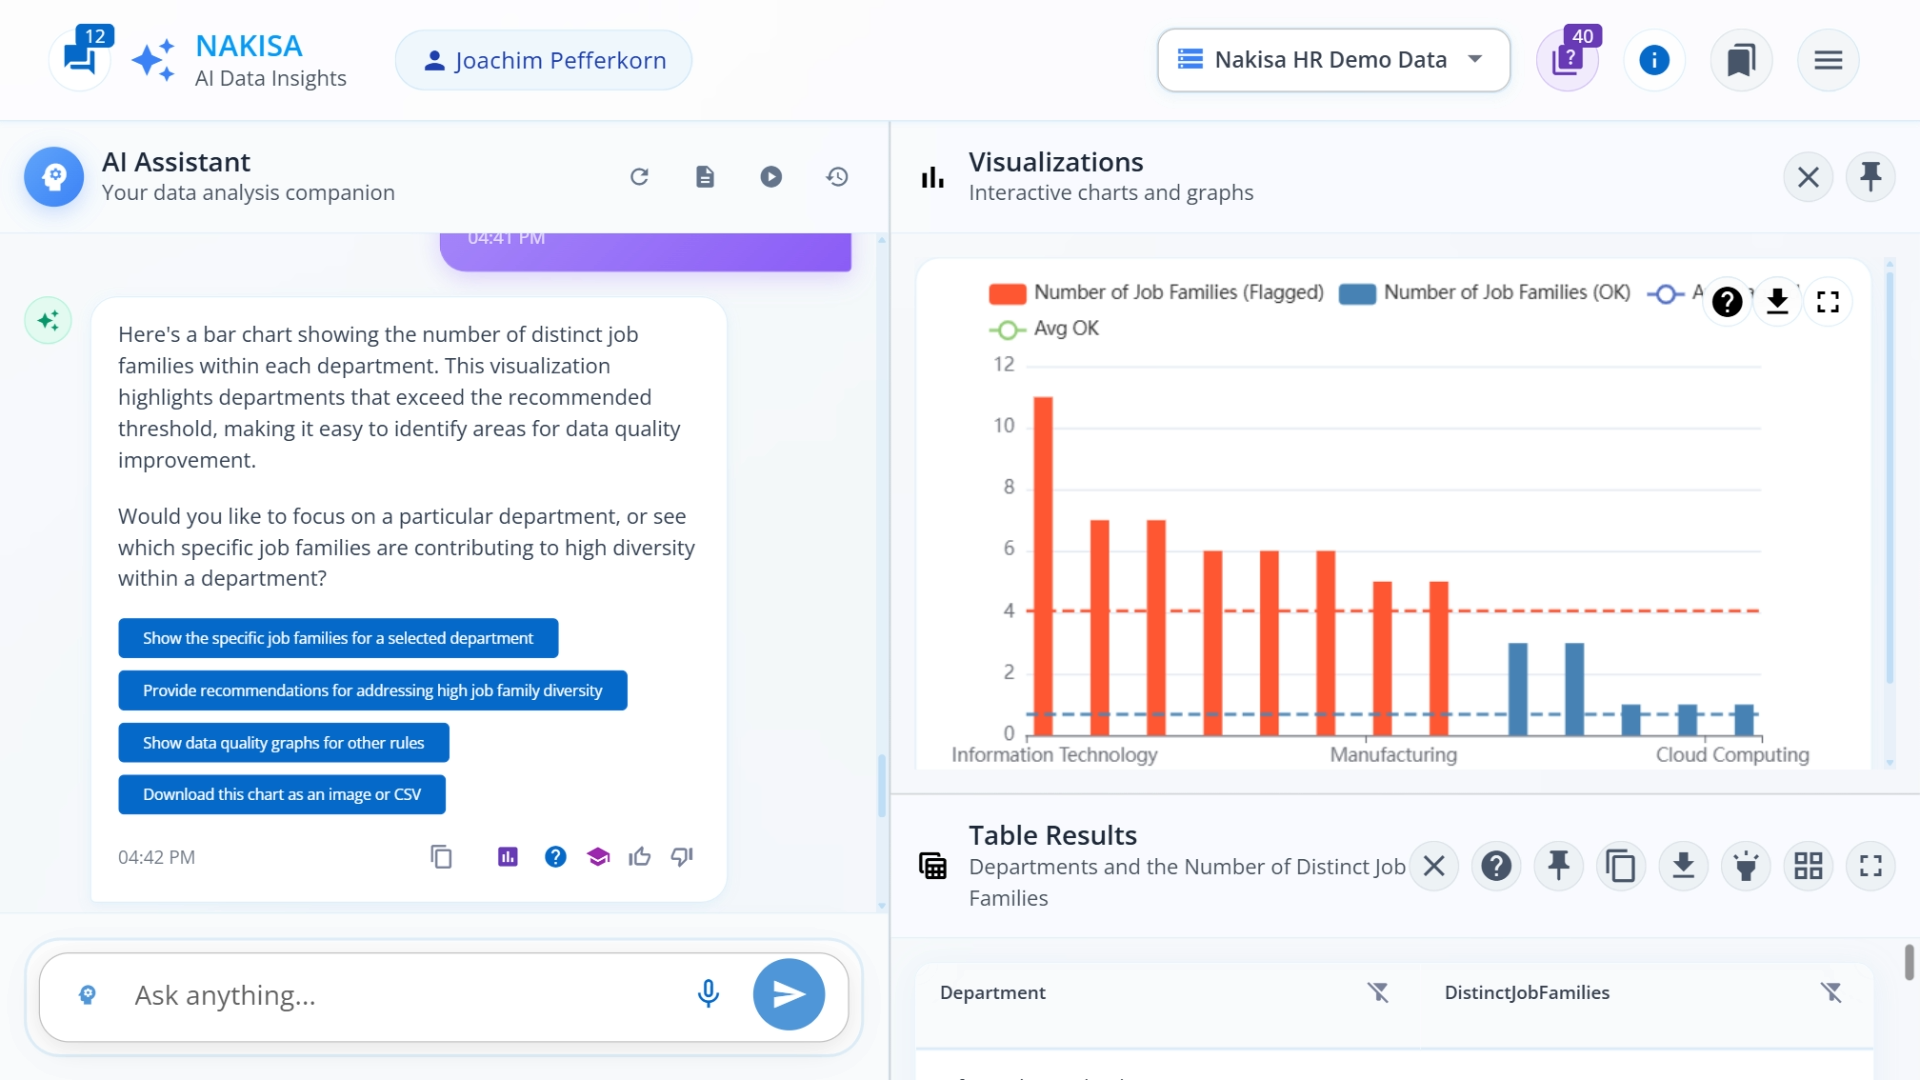
While tables are useful, a visual representation can make patterns easier to spot. We request a graph to better understand the data distribution.
Prompt: “Show me this information in a graph.”
NDI generates a color-coded bar chart showing departments with diverse job family representation, making it simple to identify which departments had the most variation in roles.
Getting granular: job family breakdown
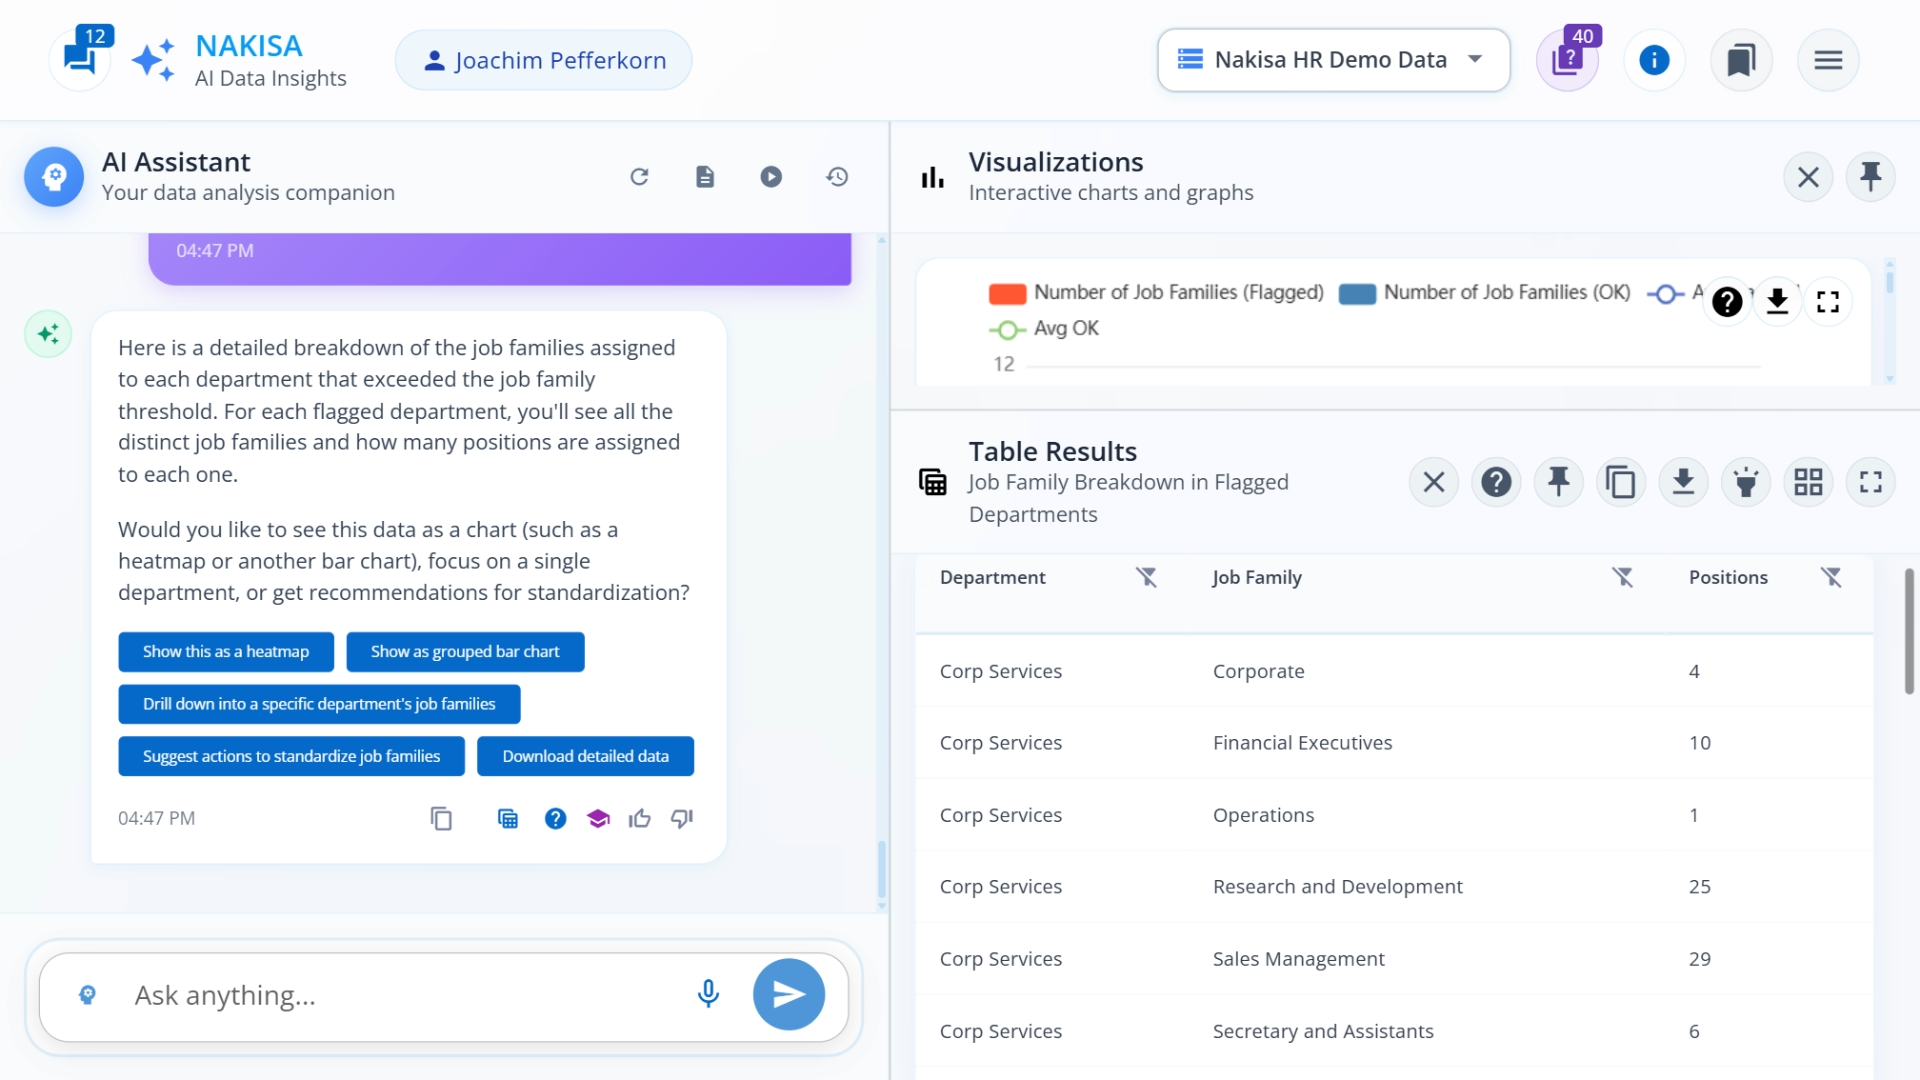
To understand the composition of these departments, we ask for a breakdown of all job families assigned to the departments above the threshold.
Prompt: “Show me a breakdown of the assigned job families for these departments.”
The table on the right automatically updates to show every job family per department along with the number of positions in each, giving us a more comprehensive view of our workforce structure.
Identifying mismatches
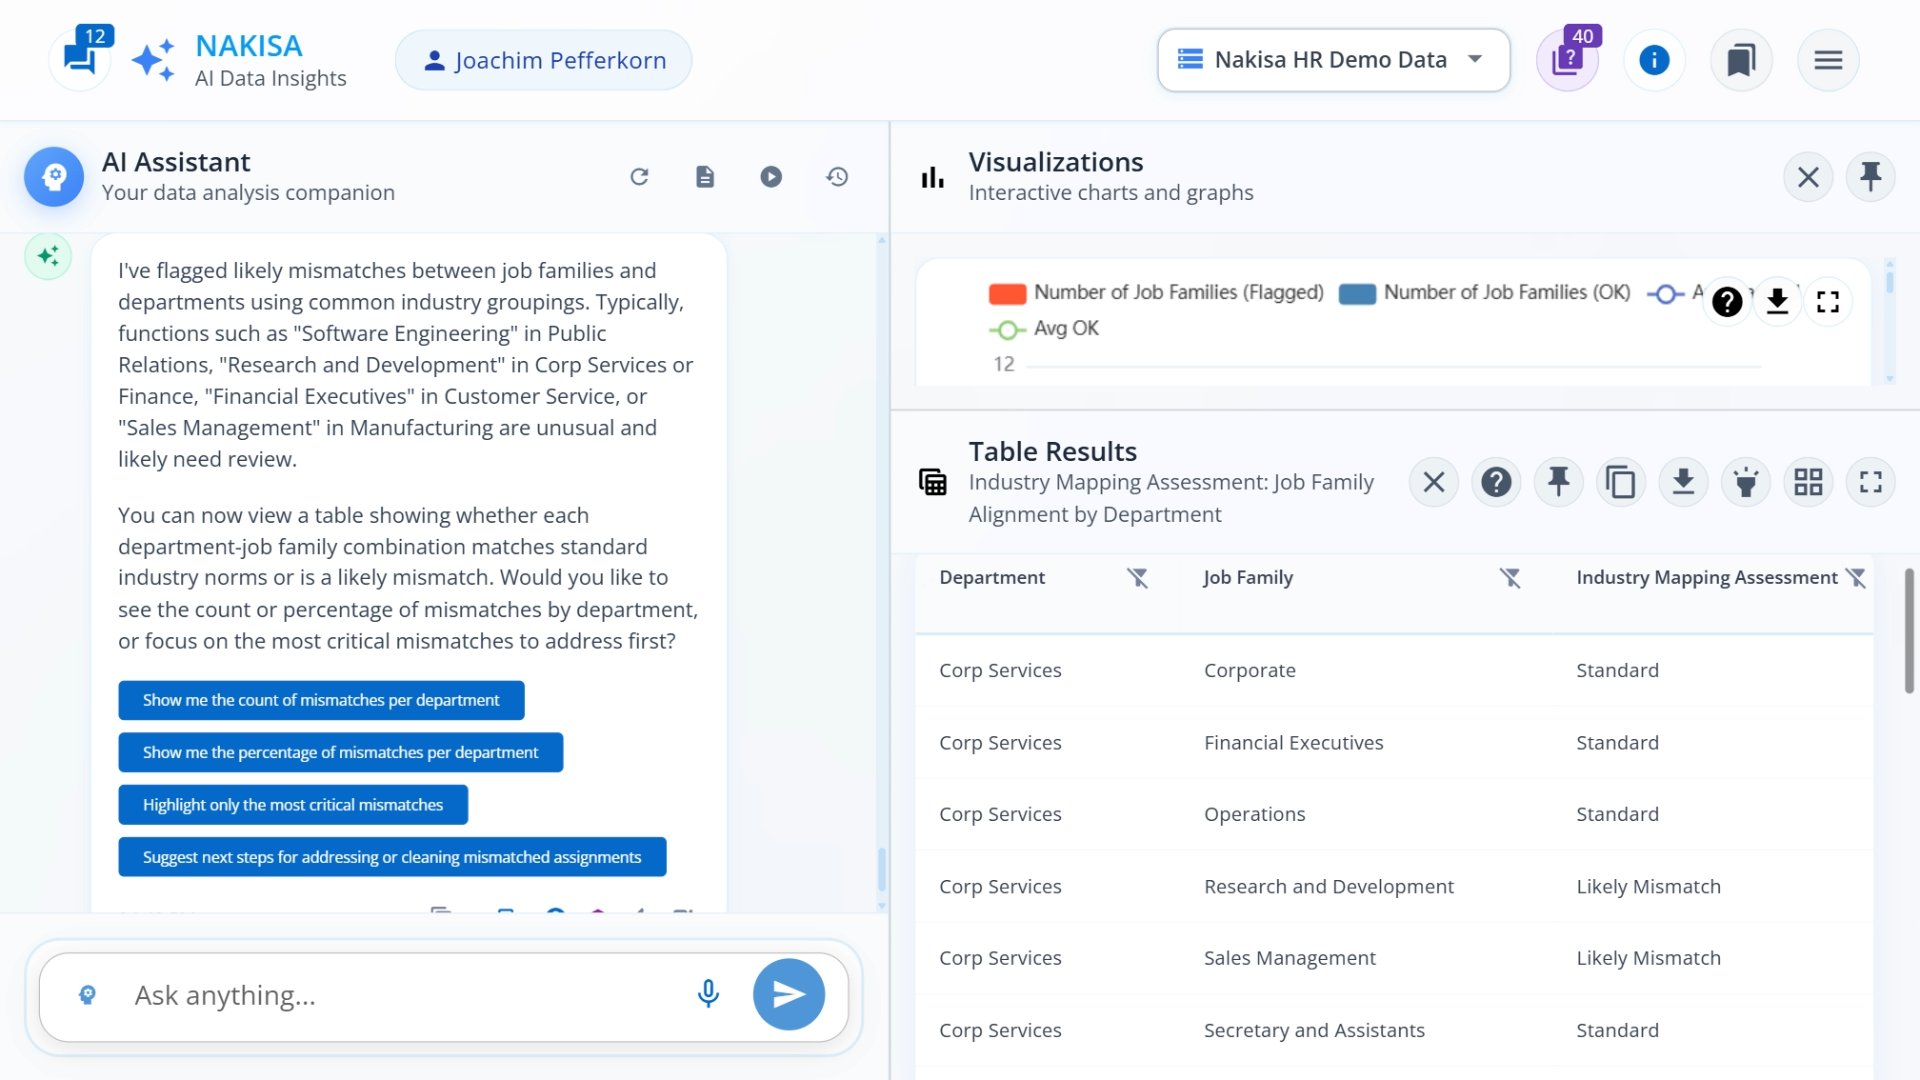
Data quality issues often stem from inconsistencies. We prompt NDI to flag mismatches between job families and departments in our data, based on common industry groupings.
Prompt: “Which of these assigned job families don't make sense to be part of these departments?”
The table refreshes to display whether each job family typically belongs in its assigned department or if there's a likely mismatch, instantly highlighting potential data errors.
Generating an action plan for a specific department
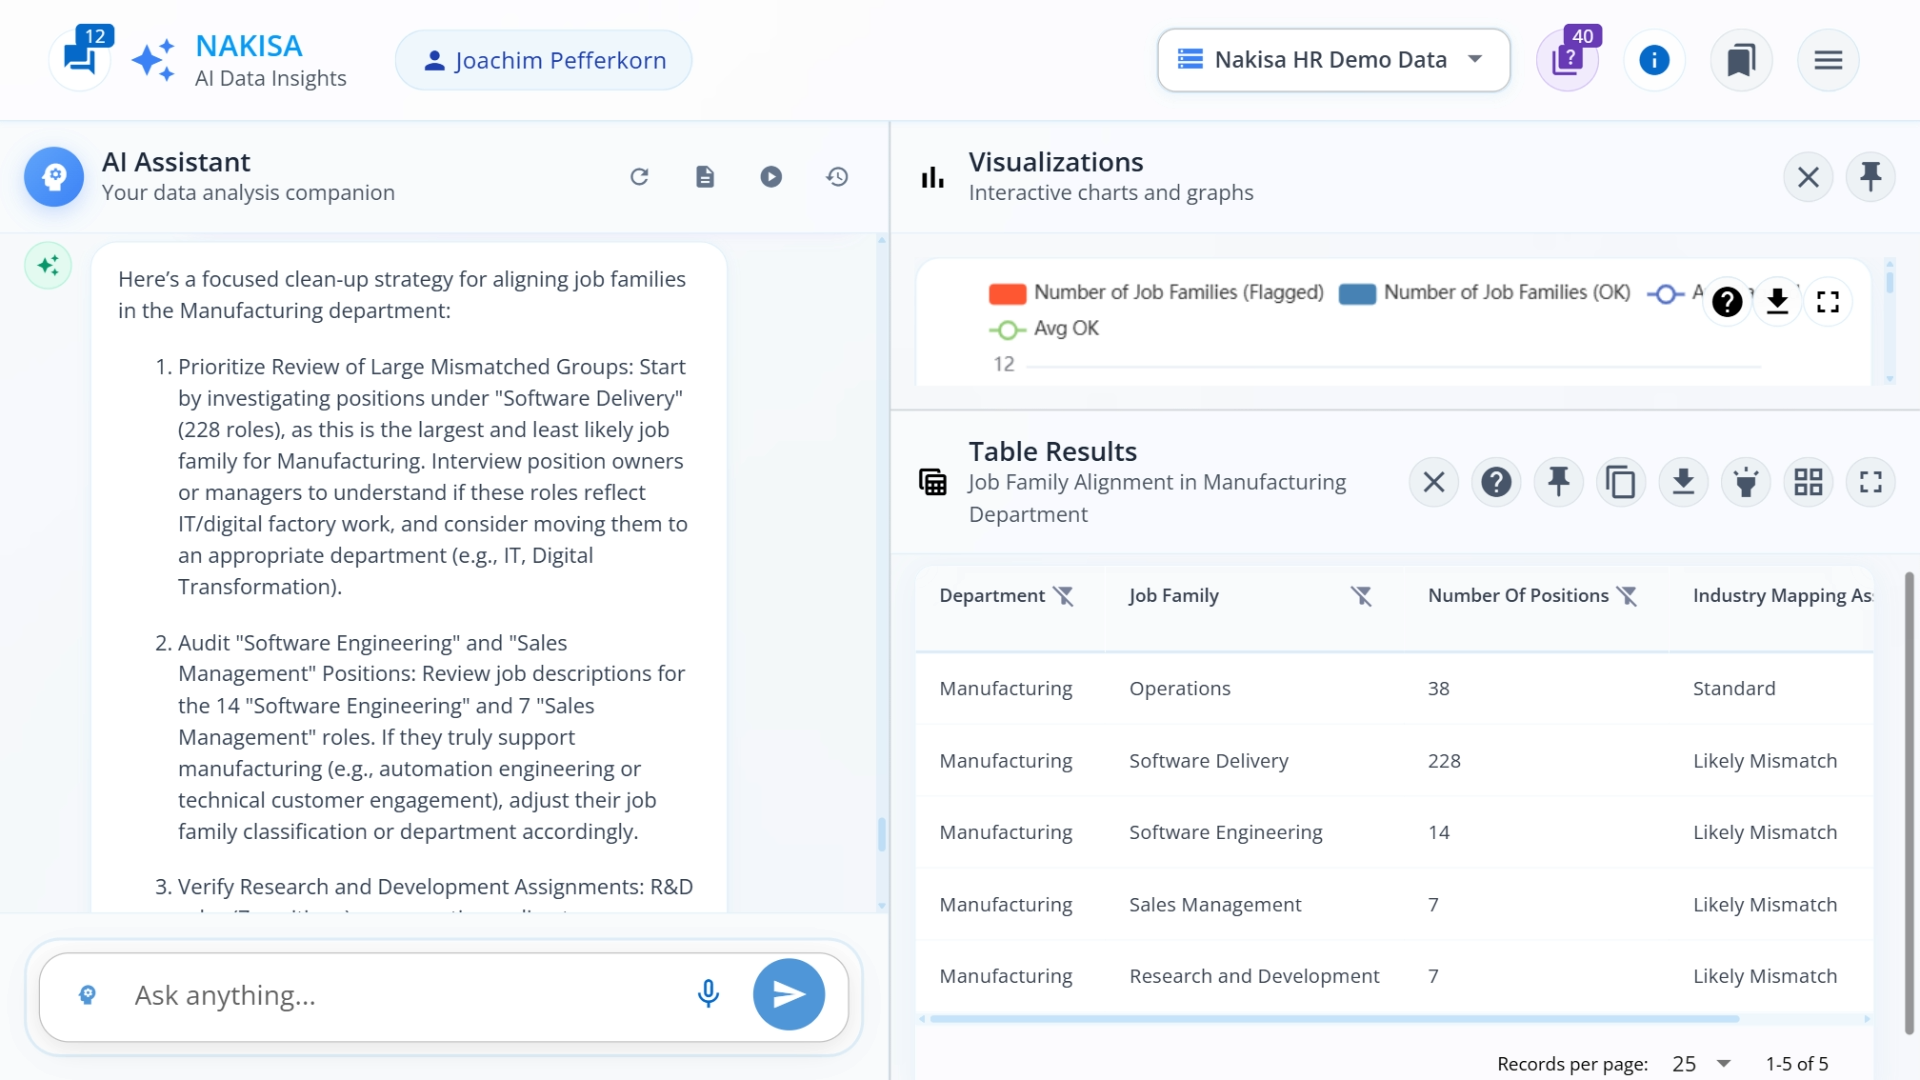
For this demonstration, we focus on the Manufacturing department. The table filters to show only job families within that department, revealing an interesting pattern: aside from operations roles, most of our job families don't typically belong in this departmental grouping according to industry standards.
Prompt: “Let’s focus on Manufacturing.”
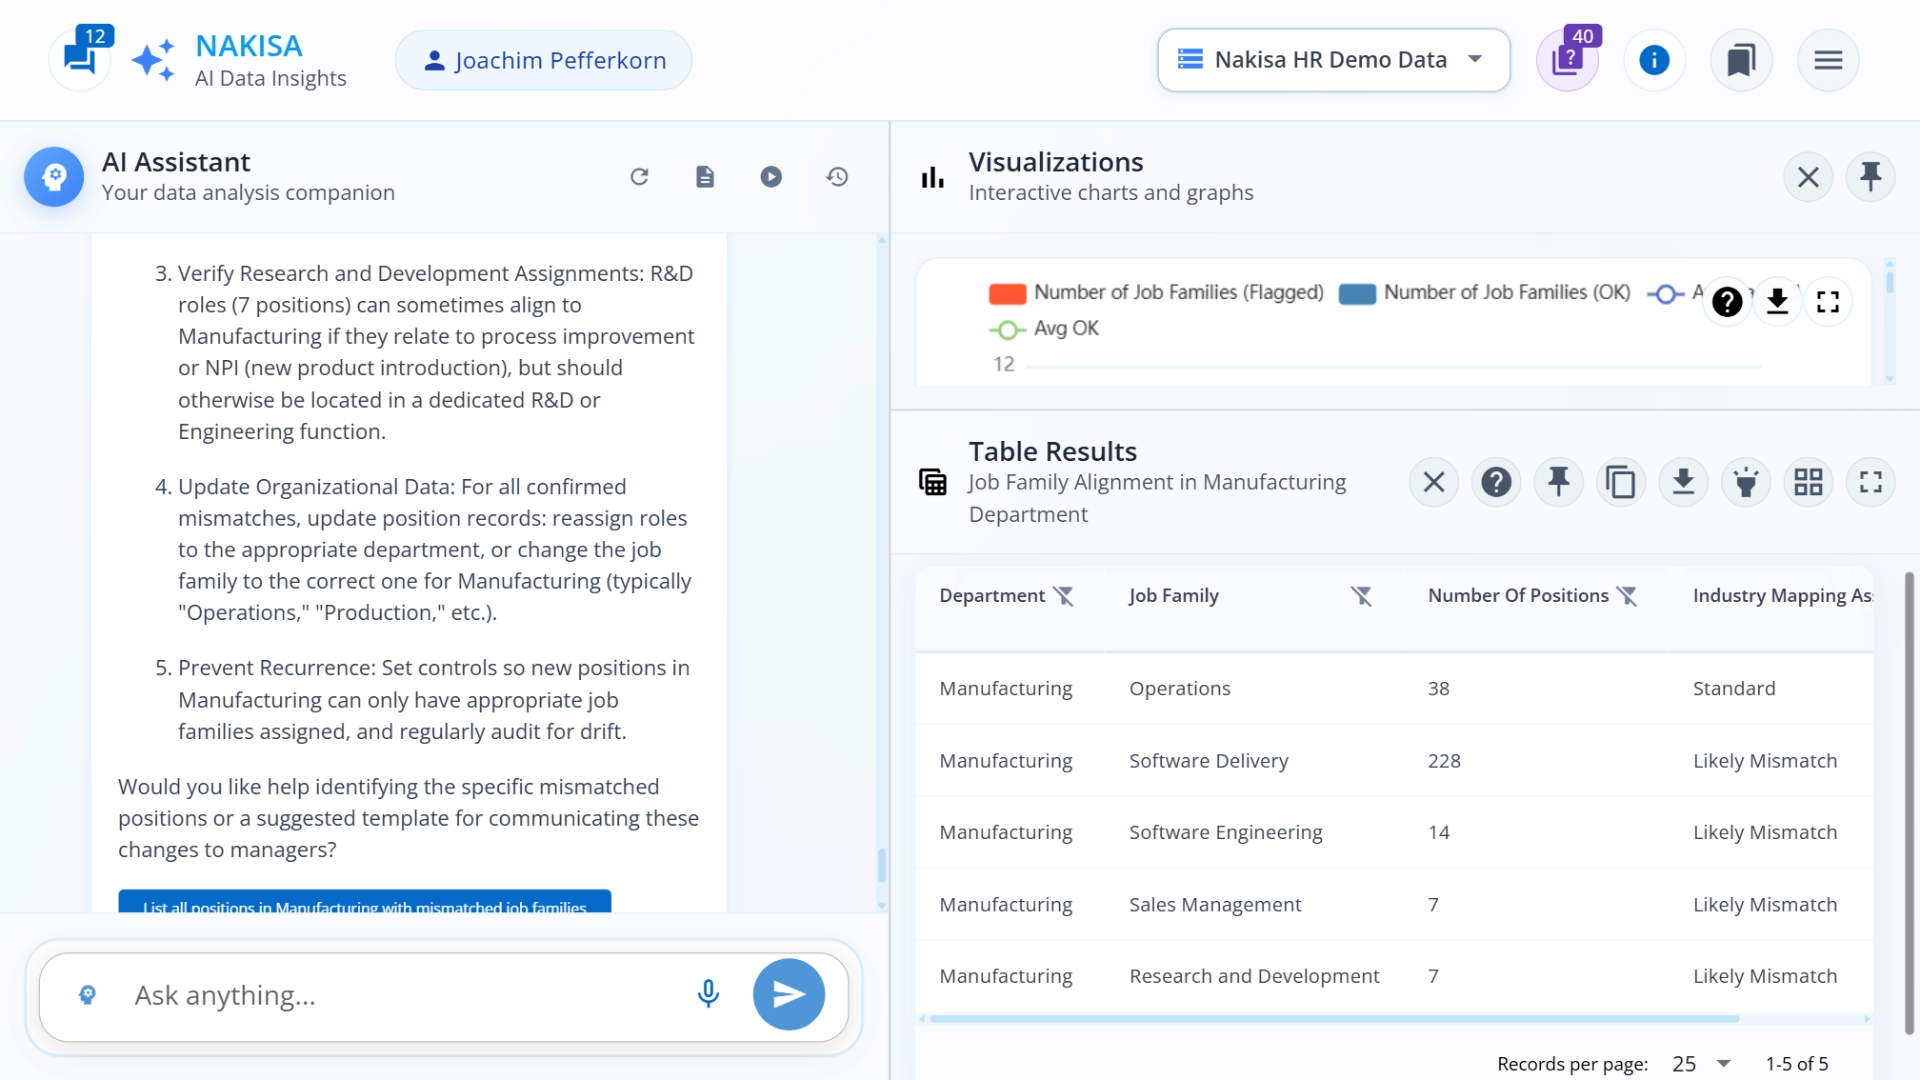
Identifying problems is only half of the process, now we need a plan to fix them. We click on one of NDI's recommended follow-up questions to receive a suggested clean-up strategy for our Manufacturing job families.
Prompt: “Recommend a clean-up strategy for Manufacturing job families.”
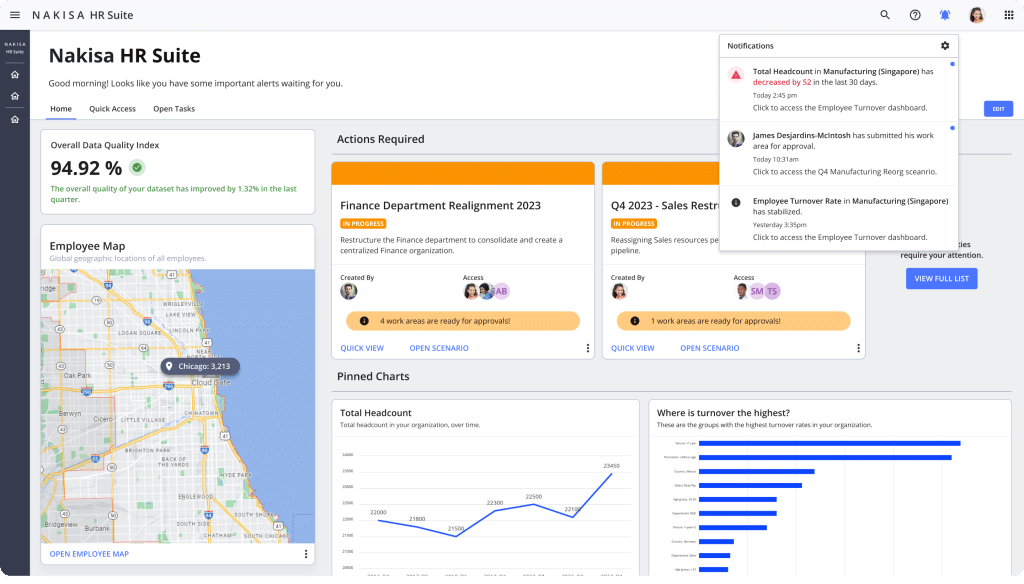
The platform provides a tailored, five-step strategy to improve our HR data quality in this specific area. With this actionable roadmap in hand, we could confidently move forward with data remediation. And if needed, we could continue the conversation to analyze other departments using the same approach. NDI also supports monitoring Agents, which should run continuously and send notifications if at any point, a rule like this one is broken. This allows for any further checks to be more passive, saving more time.
Conclusion: the power of decision intelligence platforms
In just a few minutes and through simple conversational prompts, we accomplished what traditionally would have taken days of manual analysis. We:
- Ran a comprehensive assessment of our HR data quality
- Calculated an overall Structural Data Quality Index and benchmarked against industry standards
- Identified specific rules and departments with quality issues
- Drilled down into problem areas to uncover root causes
- Received a step-by-step plan to address data quality gaps
- Set up a continuously running notification system for future rule transgressions
Nakisa Decision Intelligence transforms data quality management from a tedious, technical process into an intuitive conversation. By connecting to your HR data and leveraging AI-powered analysis, NDI empowers HR teams to maintain always-on data integrity, without requiring advanced technical skills.
Ready to see what other insights NDI can uncover in your workforce data? Find more information in our NDI Resource Hub, or ask for a free trial to experience NDI for yourself. If you'd like to schedule a free, in-depth demo with our experts, contact us now.