Why org charts still matter and what they cannot do alone
While more advanced visualization methods, such as network graphs, offer deeper analytical power, org charts still serve a unique and irreplaceable role:
- They clarify formal accountability and reporting hierarchies.
- They reveal structural bottlenecks, spans of control, and hidden asymmetries.
- They provide a shared, intuitive map of an organization’s people, roles, and responsibilities.
And yet, their real value emerges only when org charts stop being static and start becoming living analytical interfaces. That’s where decision intelligence steps in.
From query to organizational insight
Imagine typing in Nakisa Decision Intelligence (NDI):
Show me the reporting structure for all key positions in North America with their span of control.
… and instantly receiving a cleanly structured org chart filtered by precise attributes such as “Key Position,” “Region,” “Manager Position ID,” and “Span of Control” from the source data.
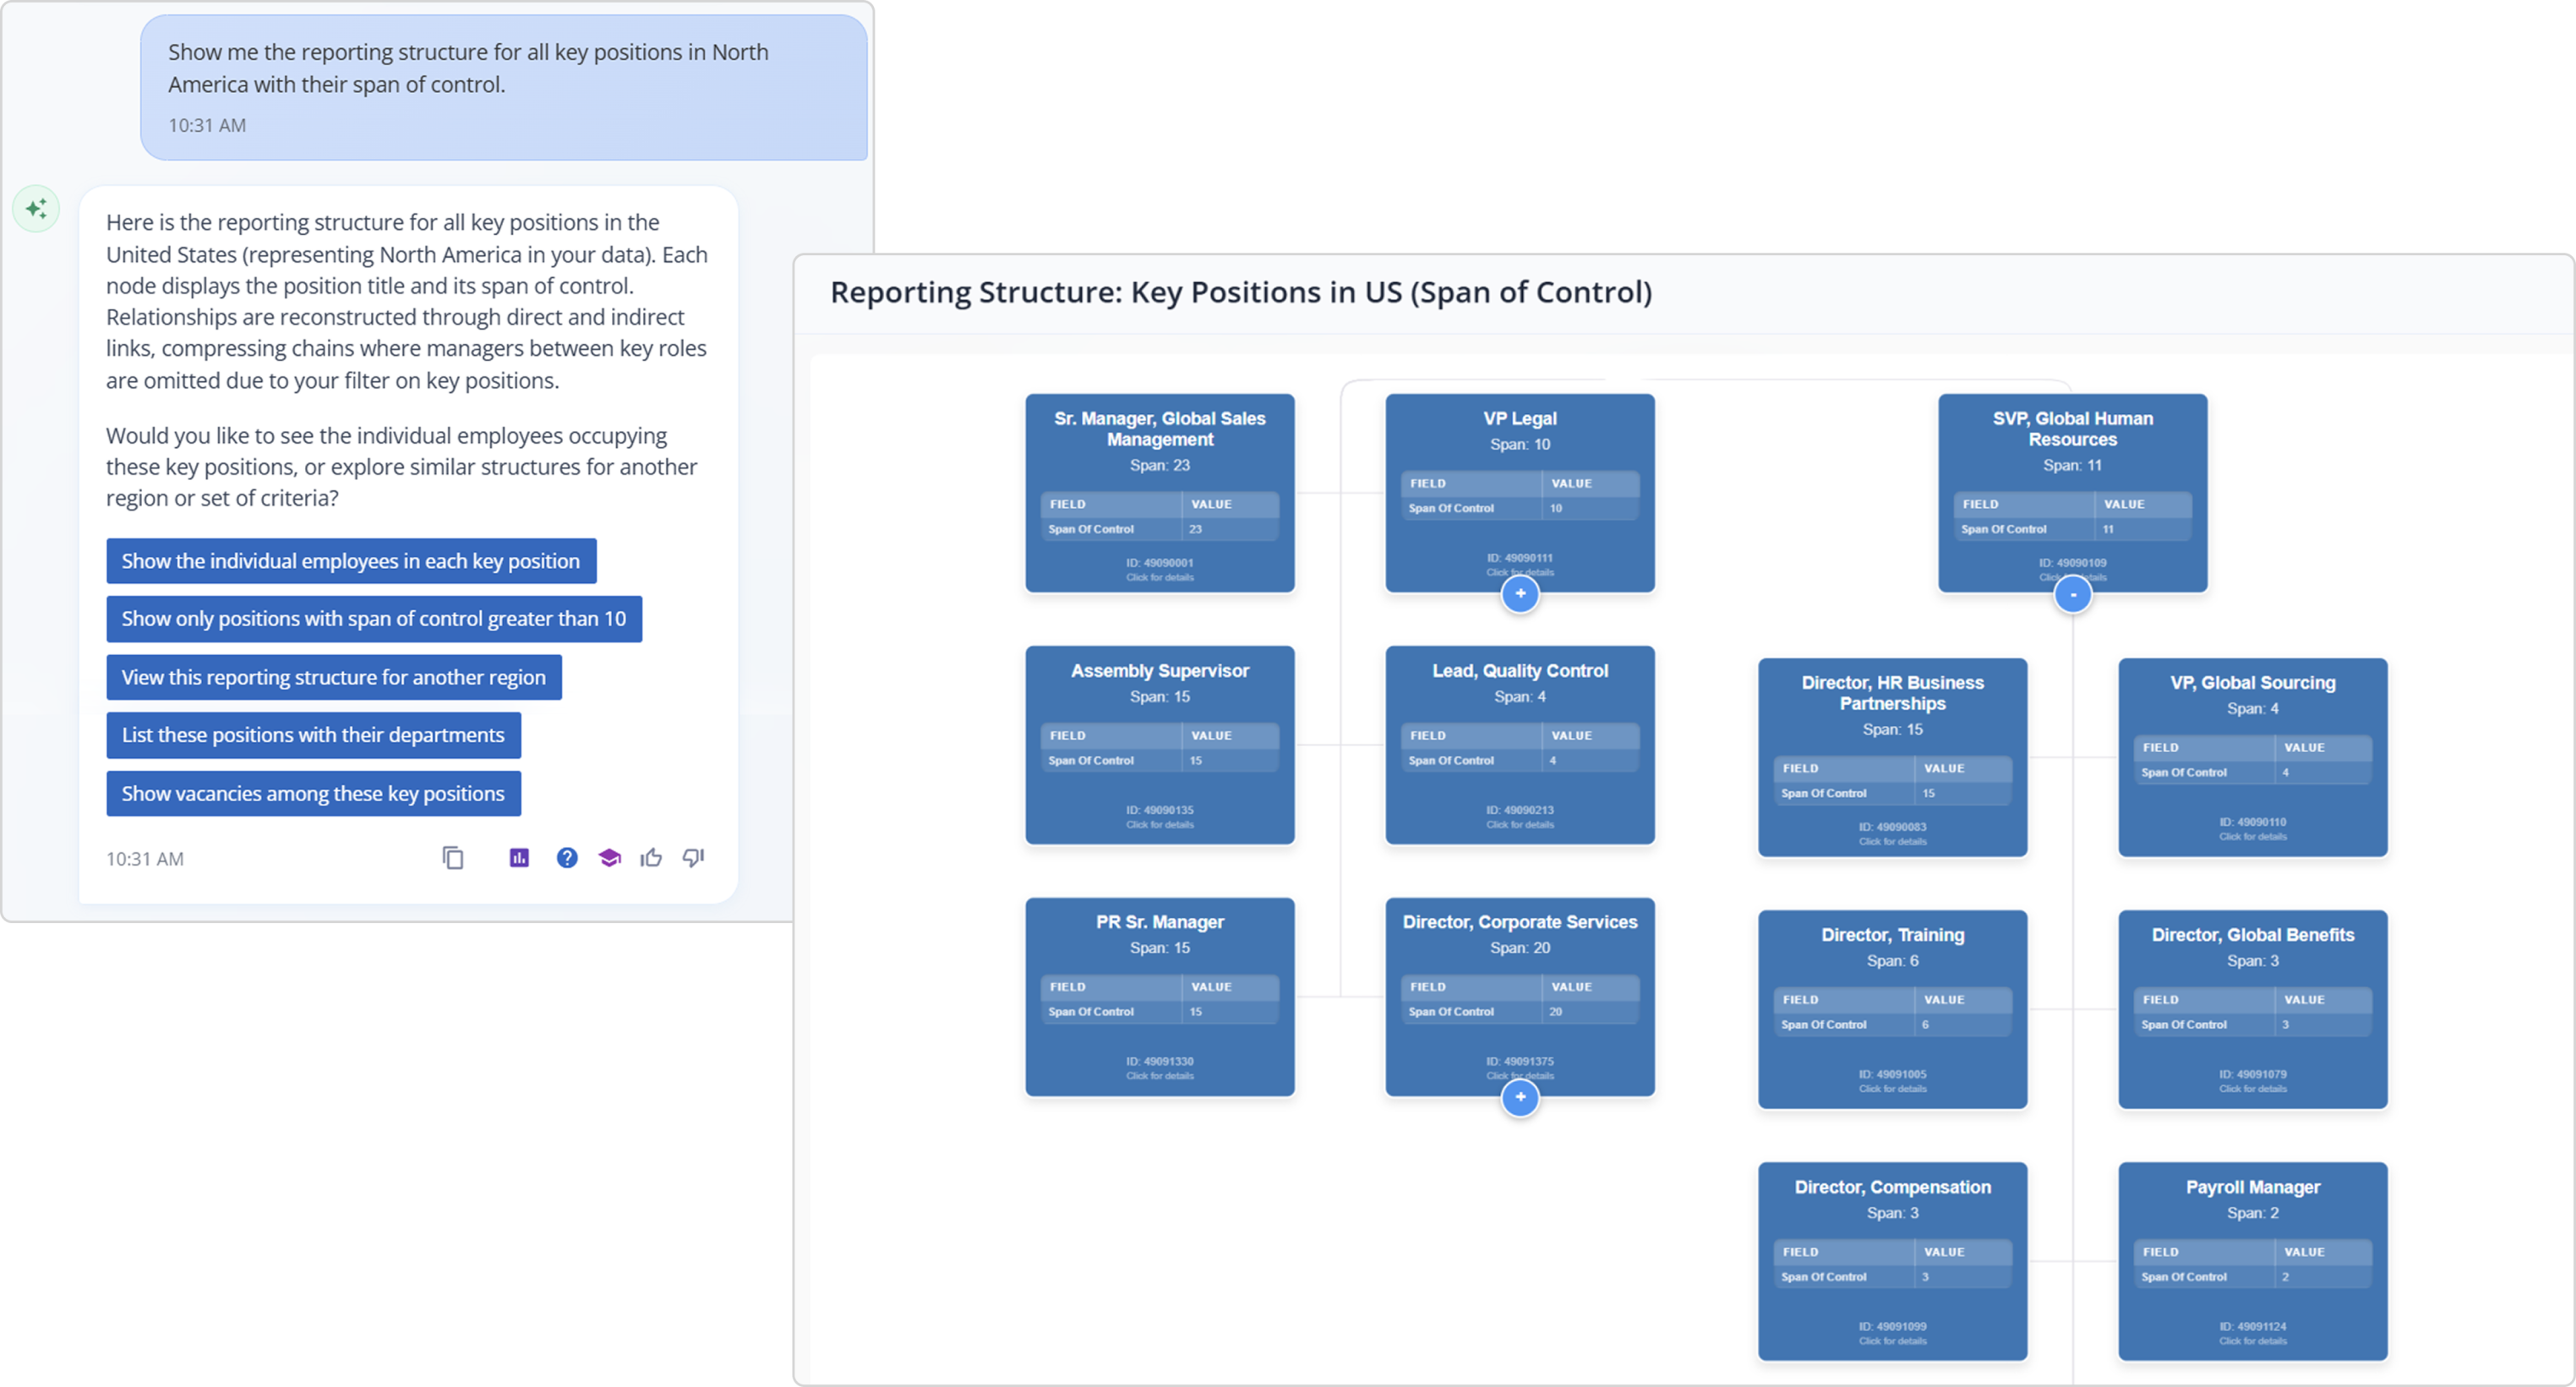
This works because modern decision intelligence platforms understand how different pieces of organizational information fit together, who reports to whom, what each role represents, and how people’s capabilities align with the expectations of their positions. By recognizing these relationships, the system builds a deeper semantic understanding of the organization, allowing natural language questions to translate seamlessly into accurate, meaningful org chart visualizations.
It’s worth appreciating what just happened here. I asked for an org chart of key positions in North America roles that can be scattered anywhere across the organizational hierarchy, often separated by multiple layers of non-key positions. Instead of returning a fragmented or disconnected set of nodes, the decision intelligence system reconstructed the missing reporting paths, inferred indirect links, and then intelligently compressed the hierarchy so that only the key positions remained visible.
The result is a clean, cohesive org chart that preserves structural truth while honoring the filter criteria.
This is exactly the kind of outcome you get when the system is guided by strong chat-level instructions (system prompts); the model understands how to rebuild context, bridge structural gaps, and produce a meaningful, renderable tree, no matter how sparse or selective the user’s request may be.
Why natural language org charting is a breakthrough
- Leaders no longer wait for analysts: Ask for a structure, get it immediately.
- HR and Ops teams diagnose organizational issues faster: Vacancies, overloaded managers, or messy dotted-line structures become visible instantly.
- Skill maps connect to reporting hierarchies: For the first time, you can visualize actual vs. required capabilities within a single hierarchy.
- Organizational storytelling becomes accessible: Executives can go into a board meeting with self-updating visuals that align with the latest workforce data.
Examples
Here are some examples to show how org charts can help in various situations.
Prompt:
Show the org chart of all positions classified as Key Position along with the employees who currently hold them, including their performance and potential ratings.

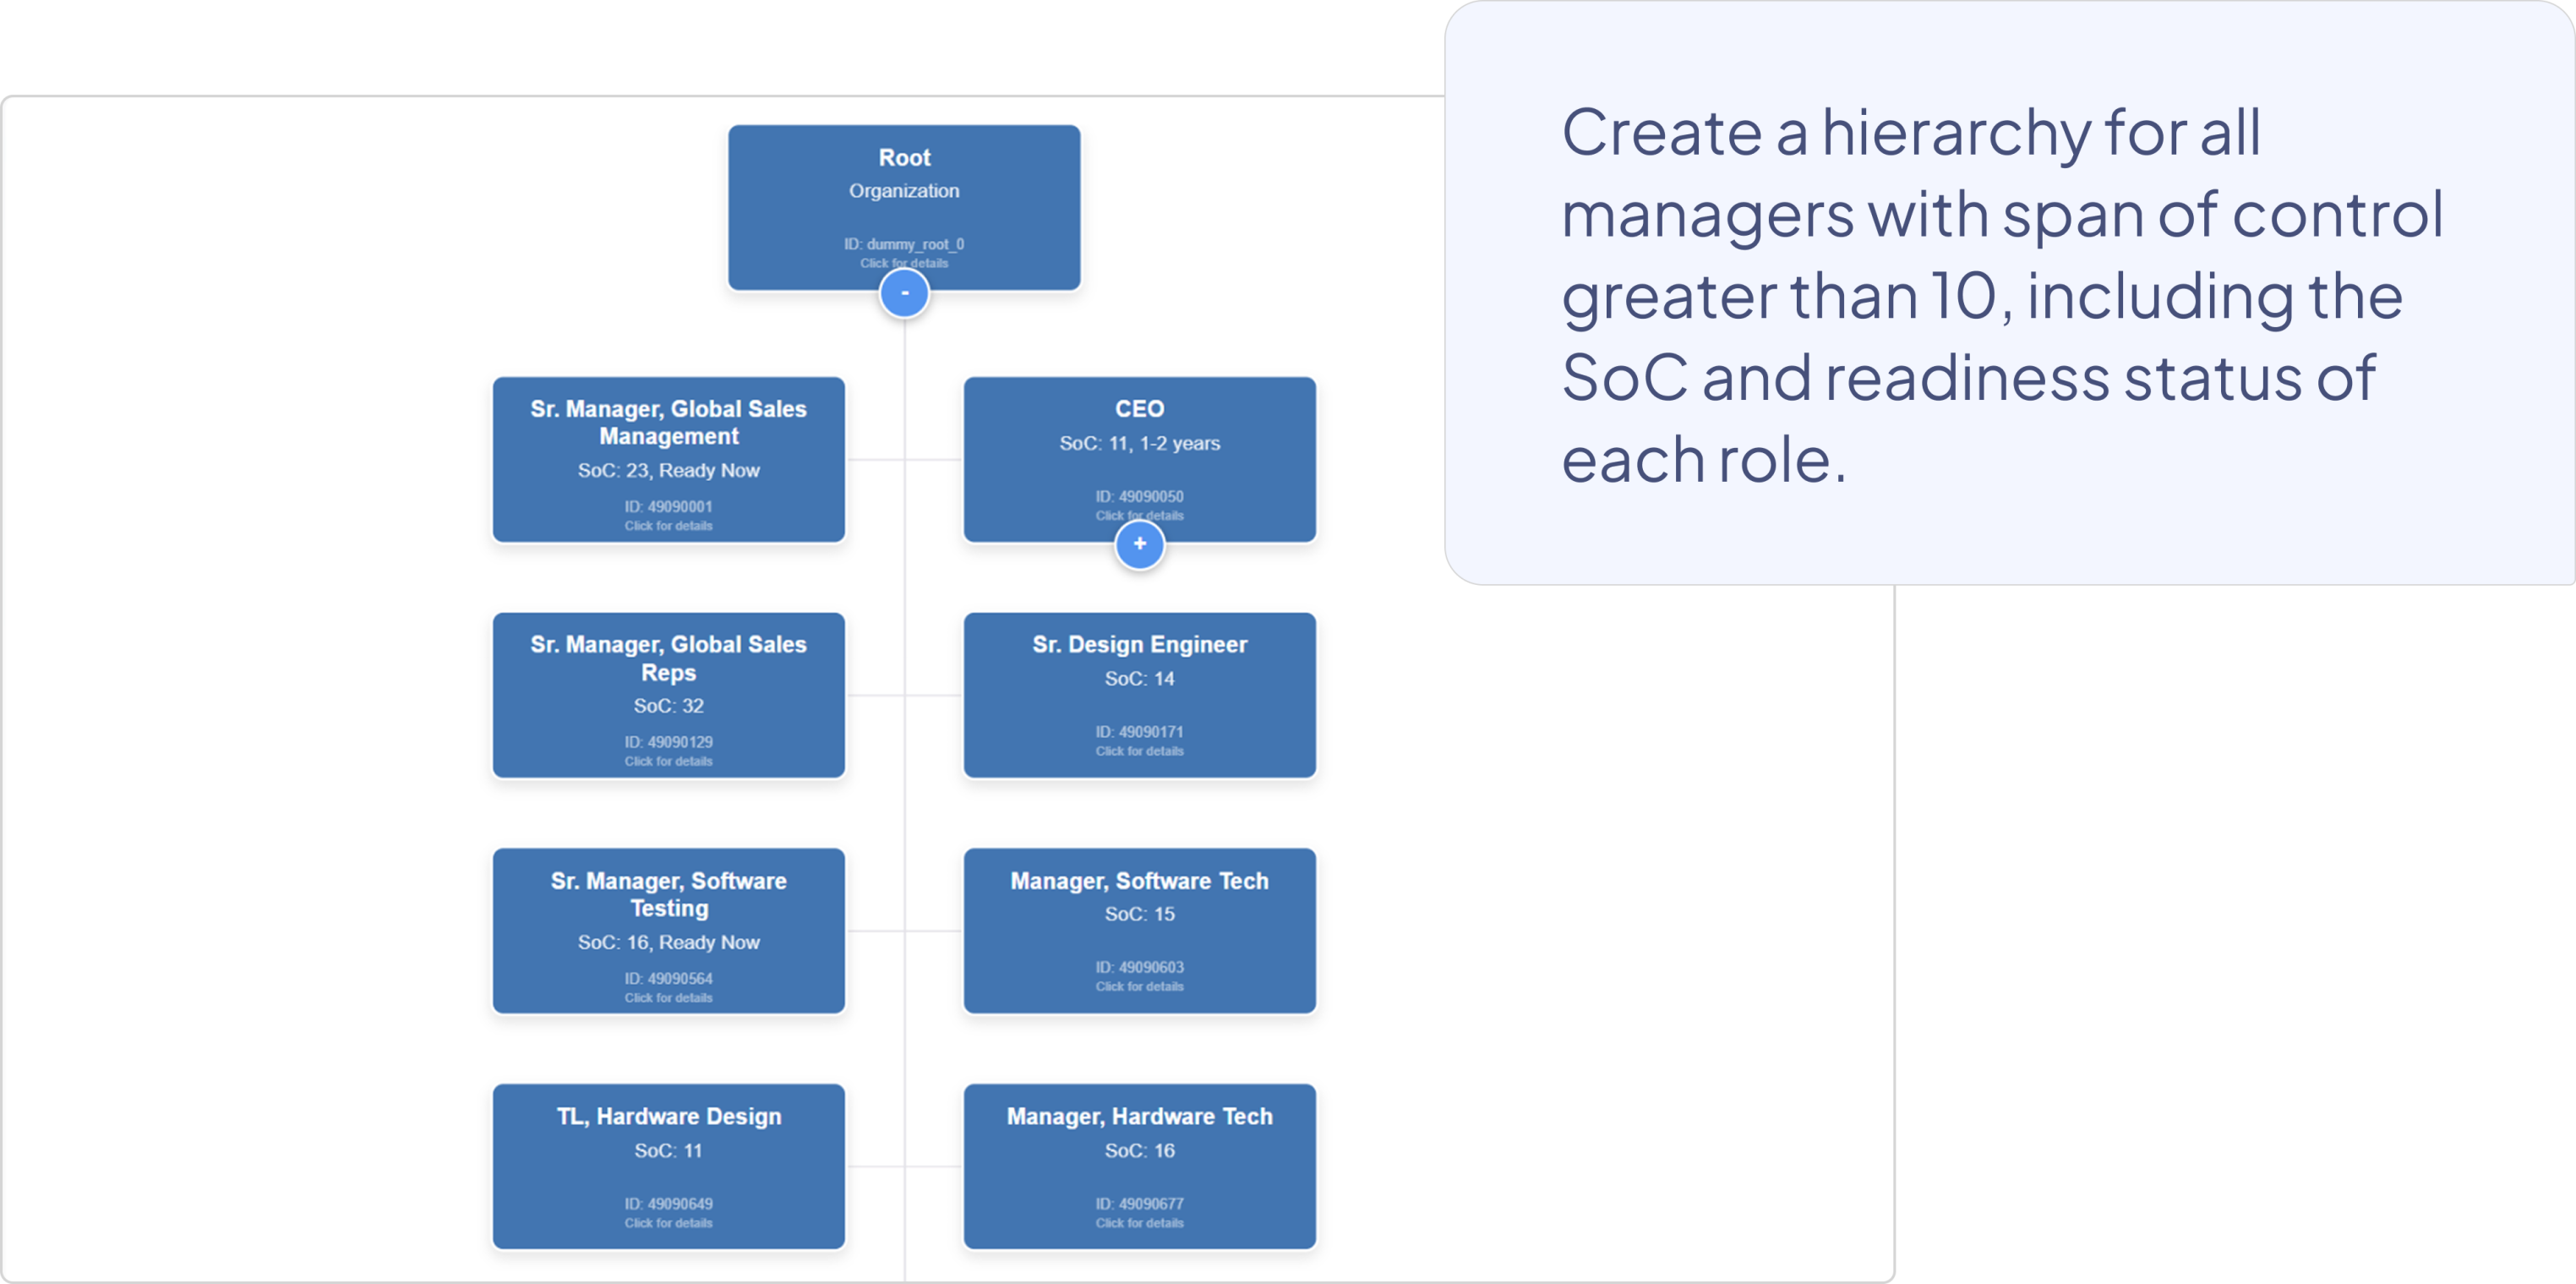
Prompt:
Create a hierarchy for all managers with a span of control greater than 10, including the span of control (SoC) and readiness status of each role.
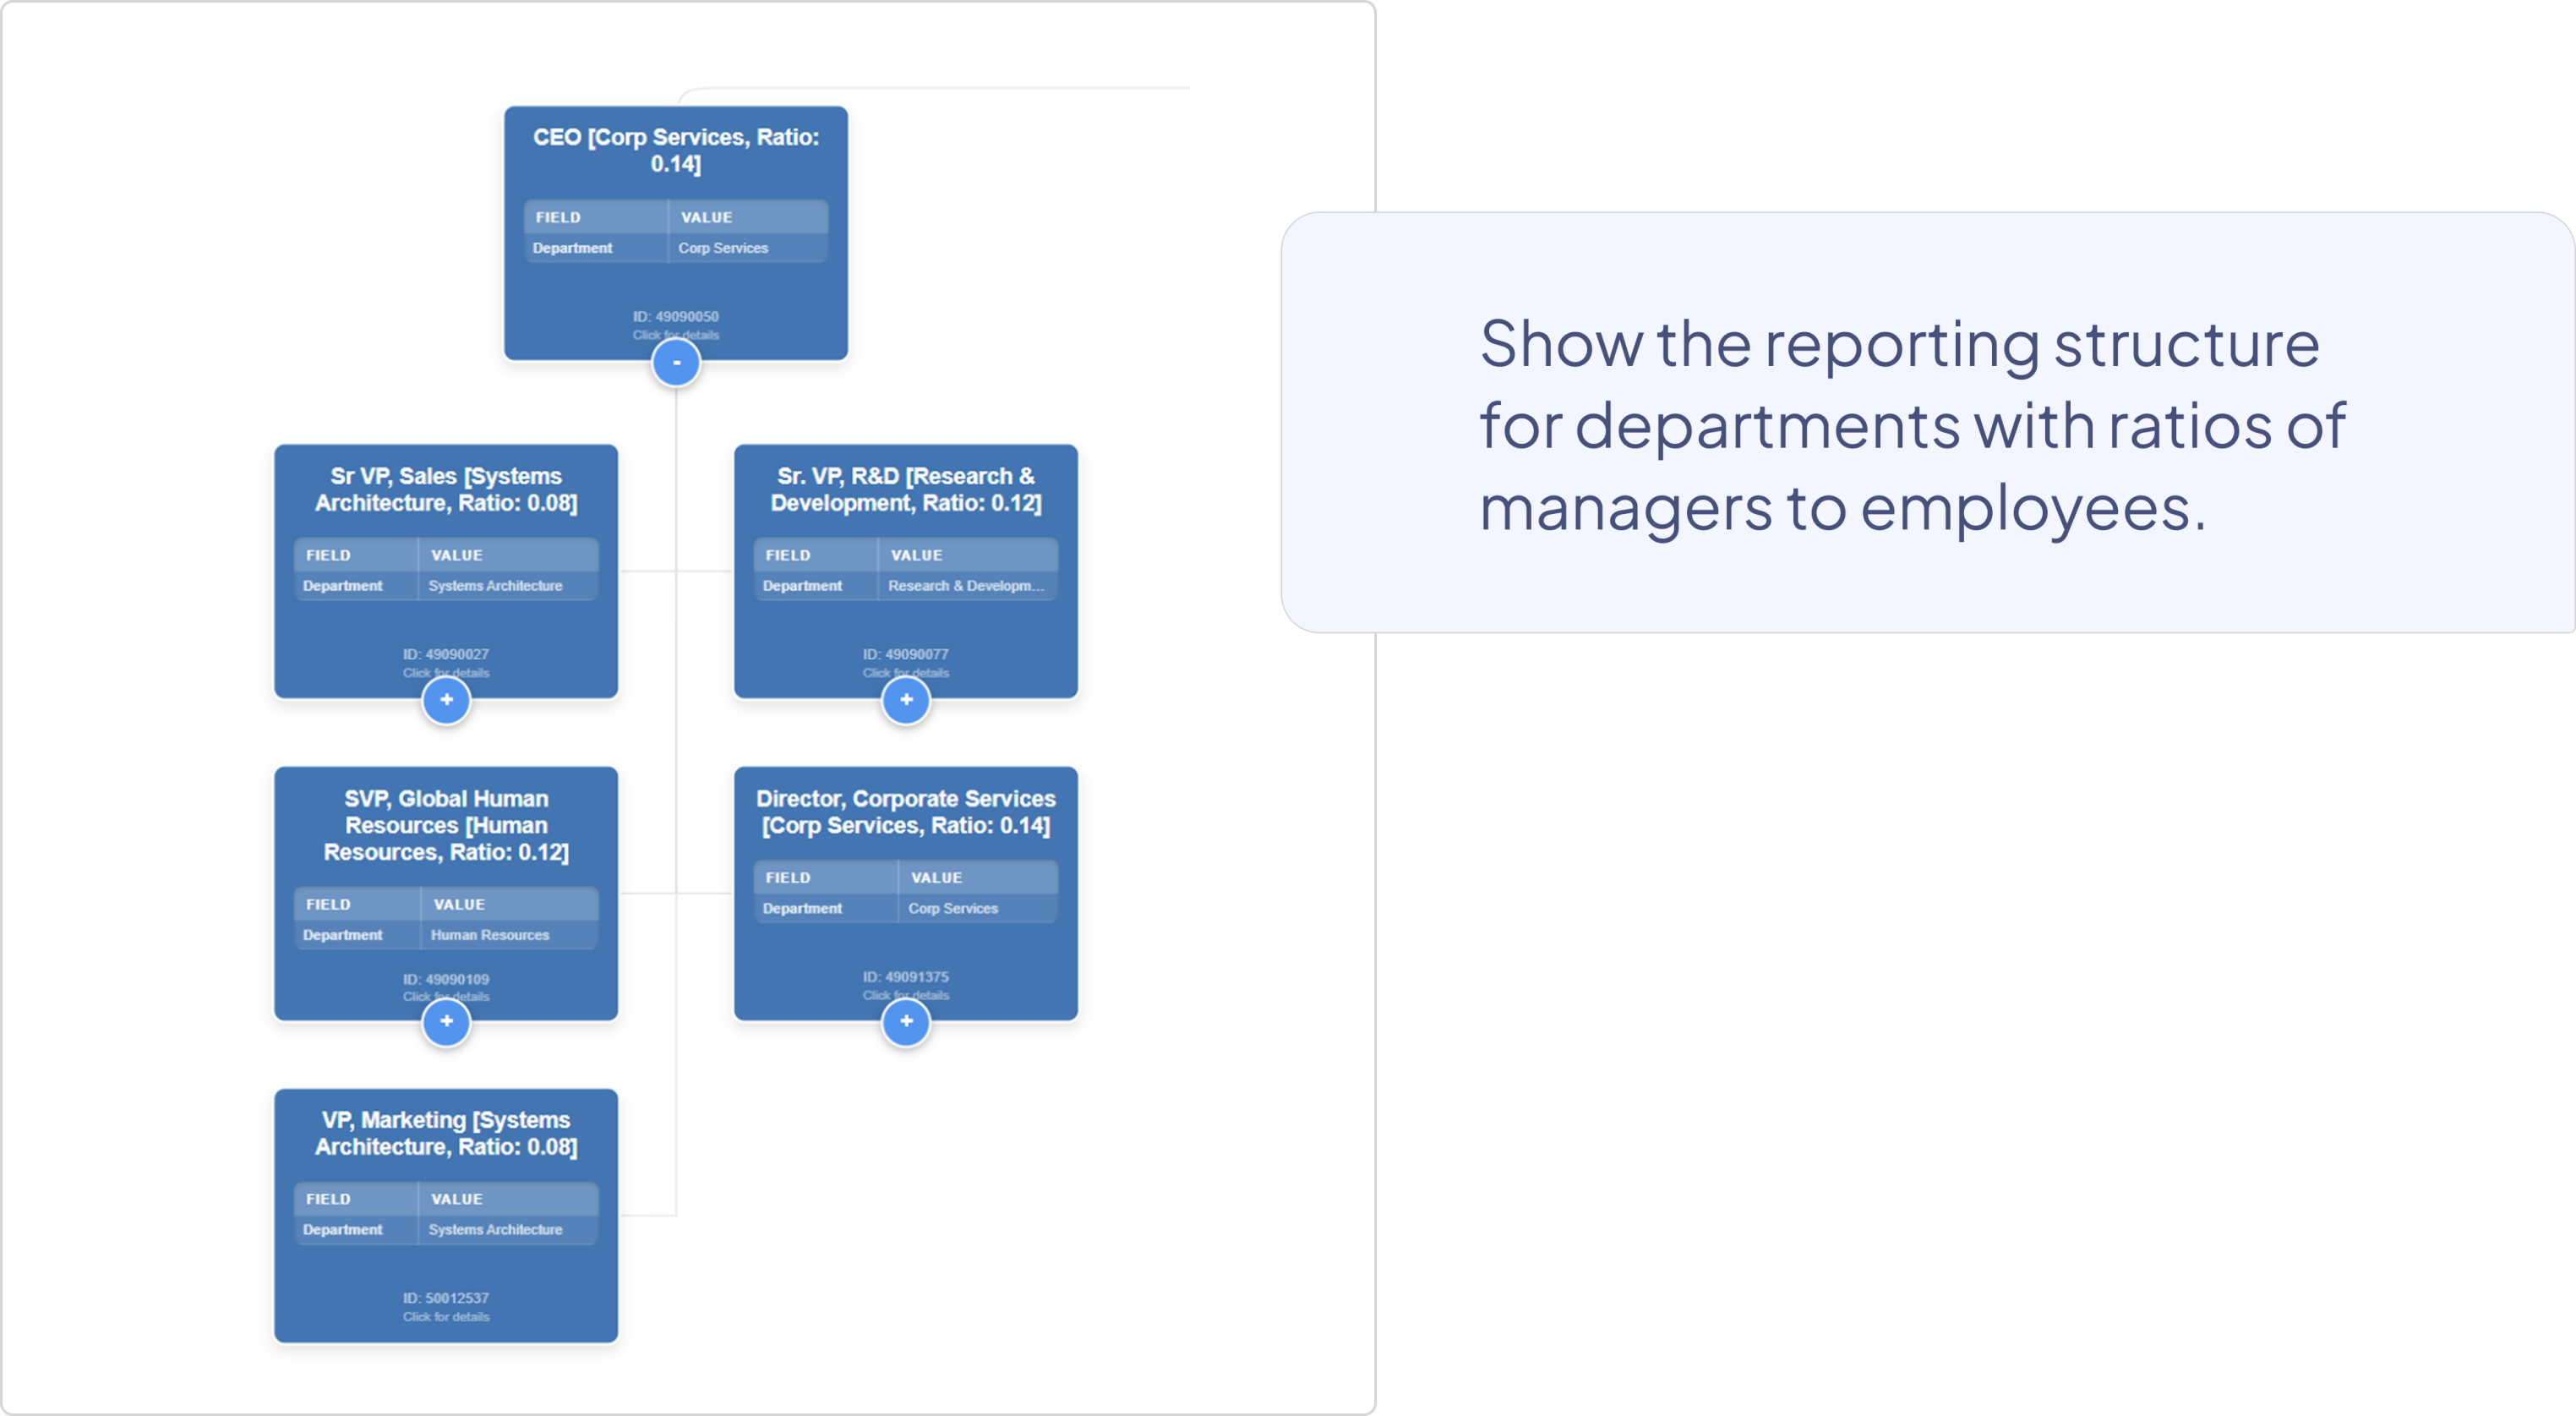
Structural health, efficiency, and reorganization diagnostics
Prompt:
Show the reporting structure for departments with ratios of managers to employees.
Prompt:
Visualize the hierarchy of all vacant positions.
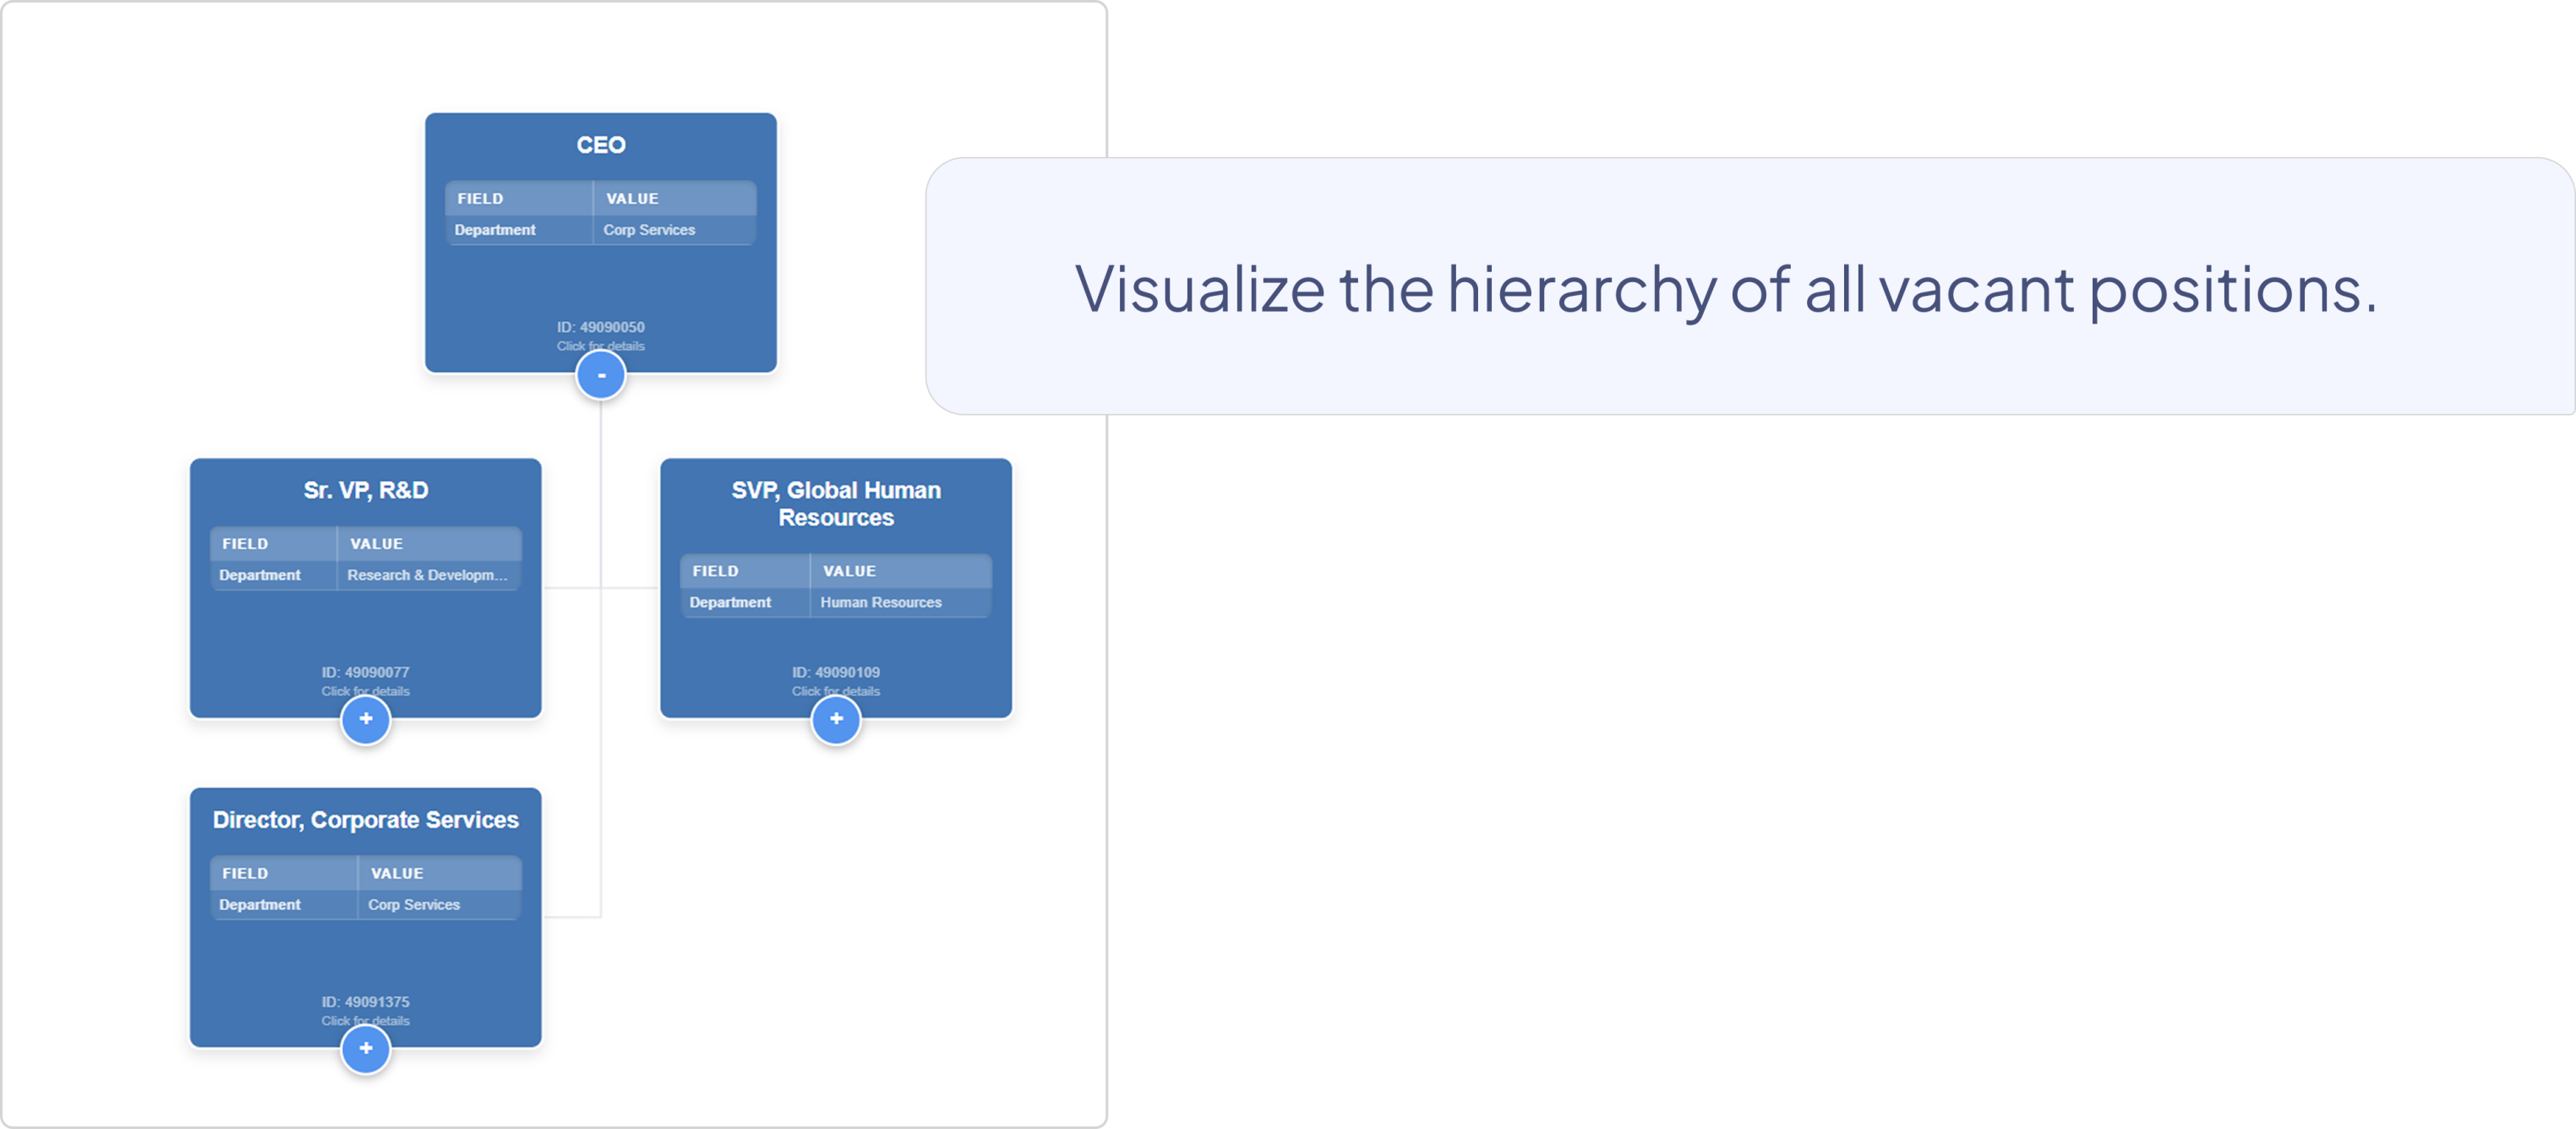
Seems like an organization in the making.
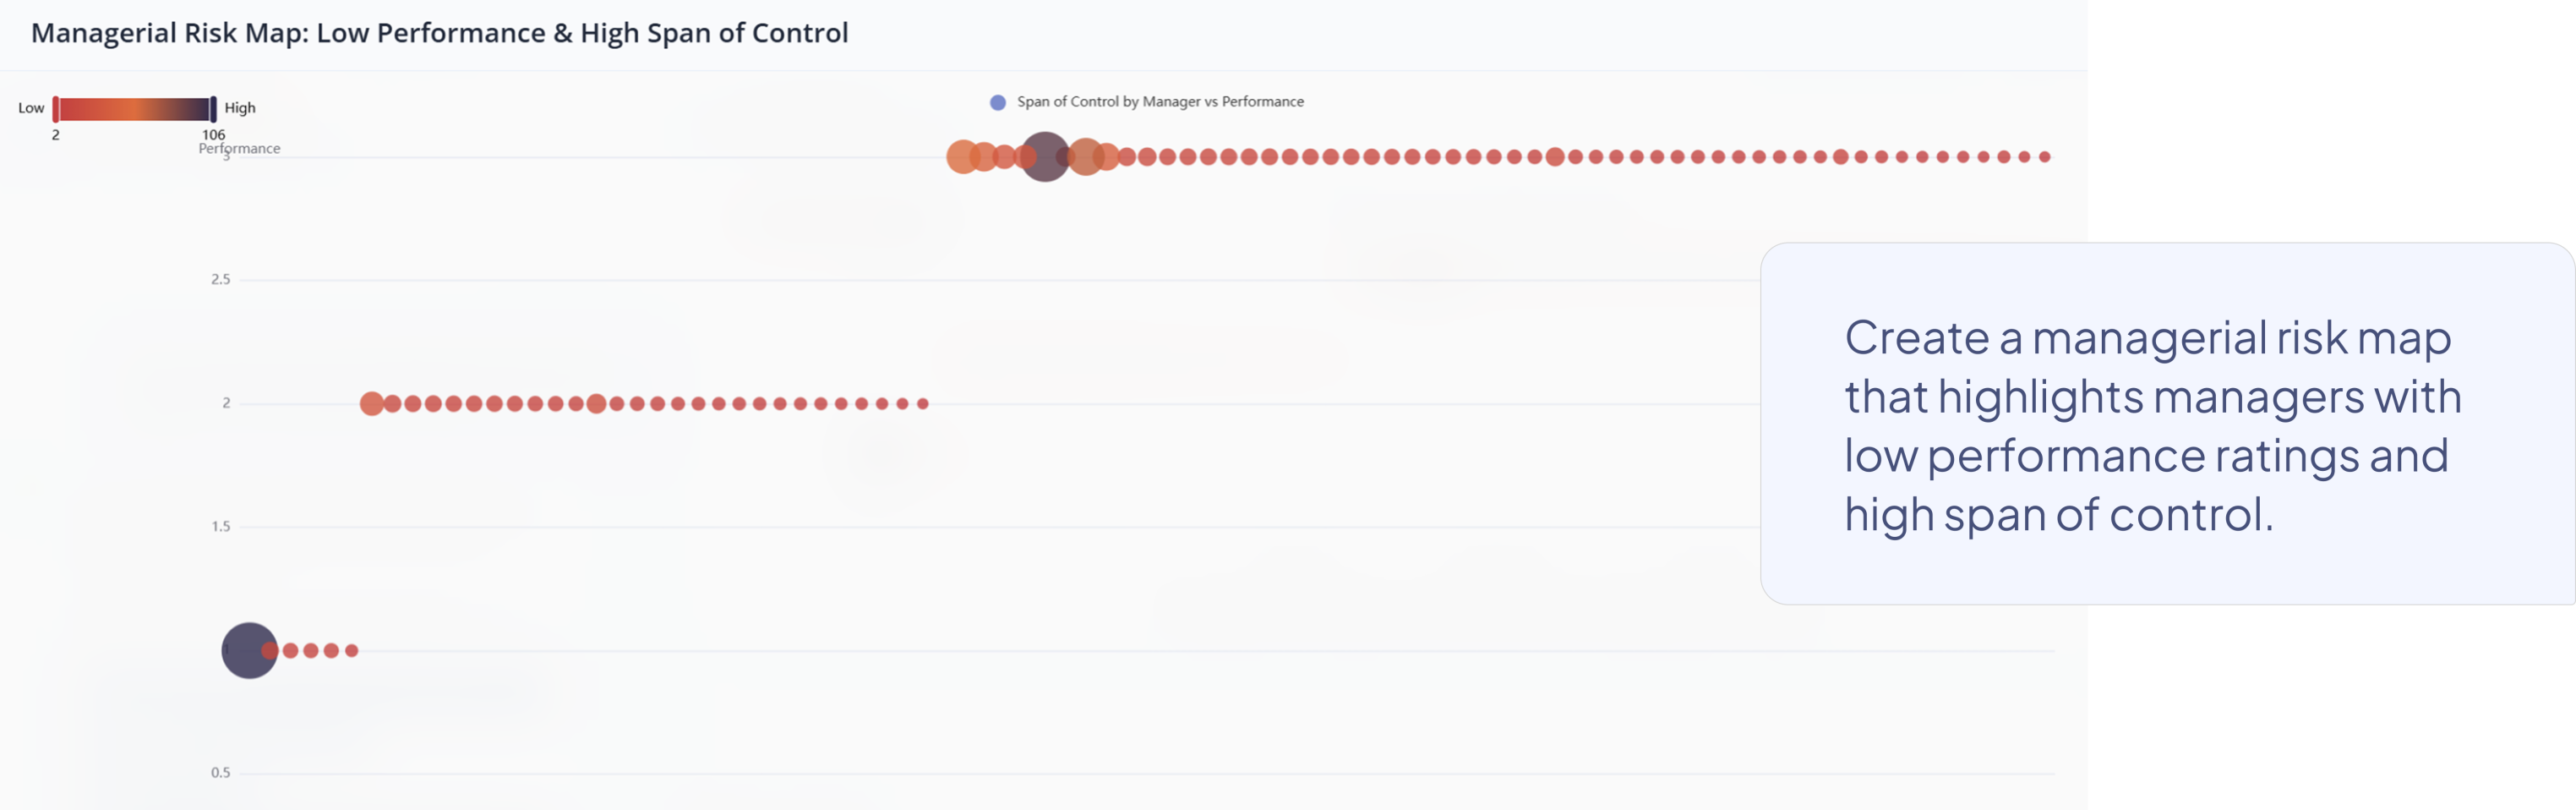
Beyond org charts
As I mentioned before, org charts are old tools. They have their place in formal reporting. But Nakisa Decision Intelligence (NDI) can do much more. We have very powerful visualizations to see more into the organization's needs and patterns. Here are some examples where we go beyond org charts and show deeper insights.
Prompt:
Create a managerial risk map that highlights managers with low performance ratings and a high span of control.
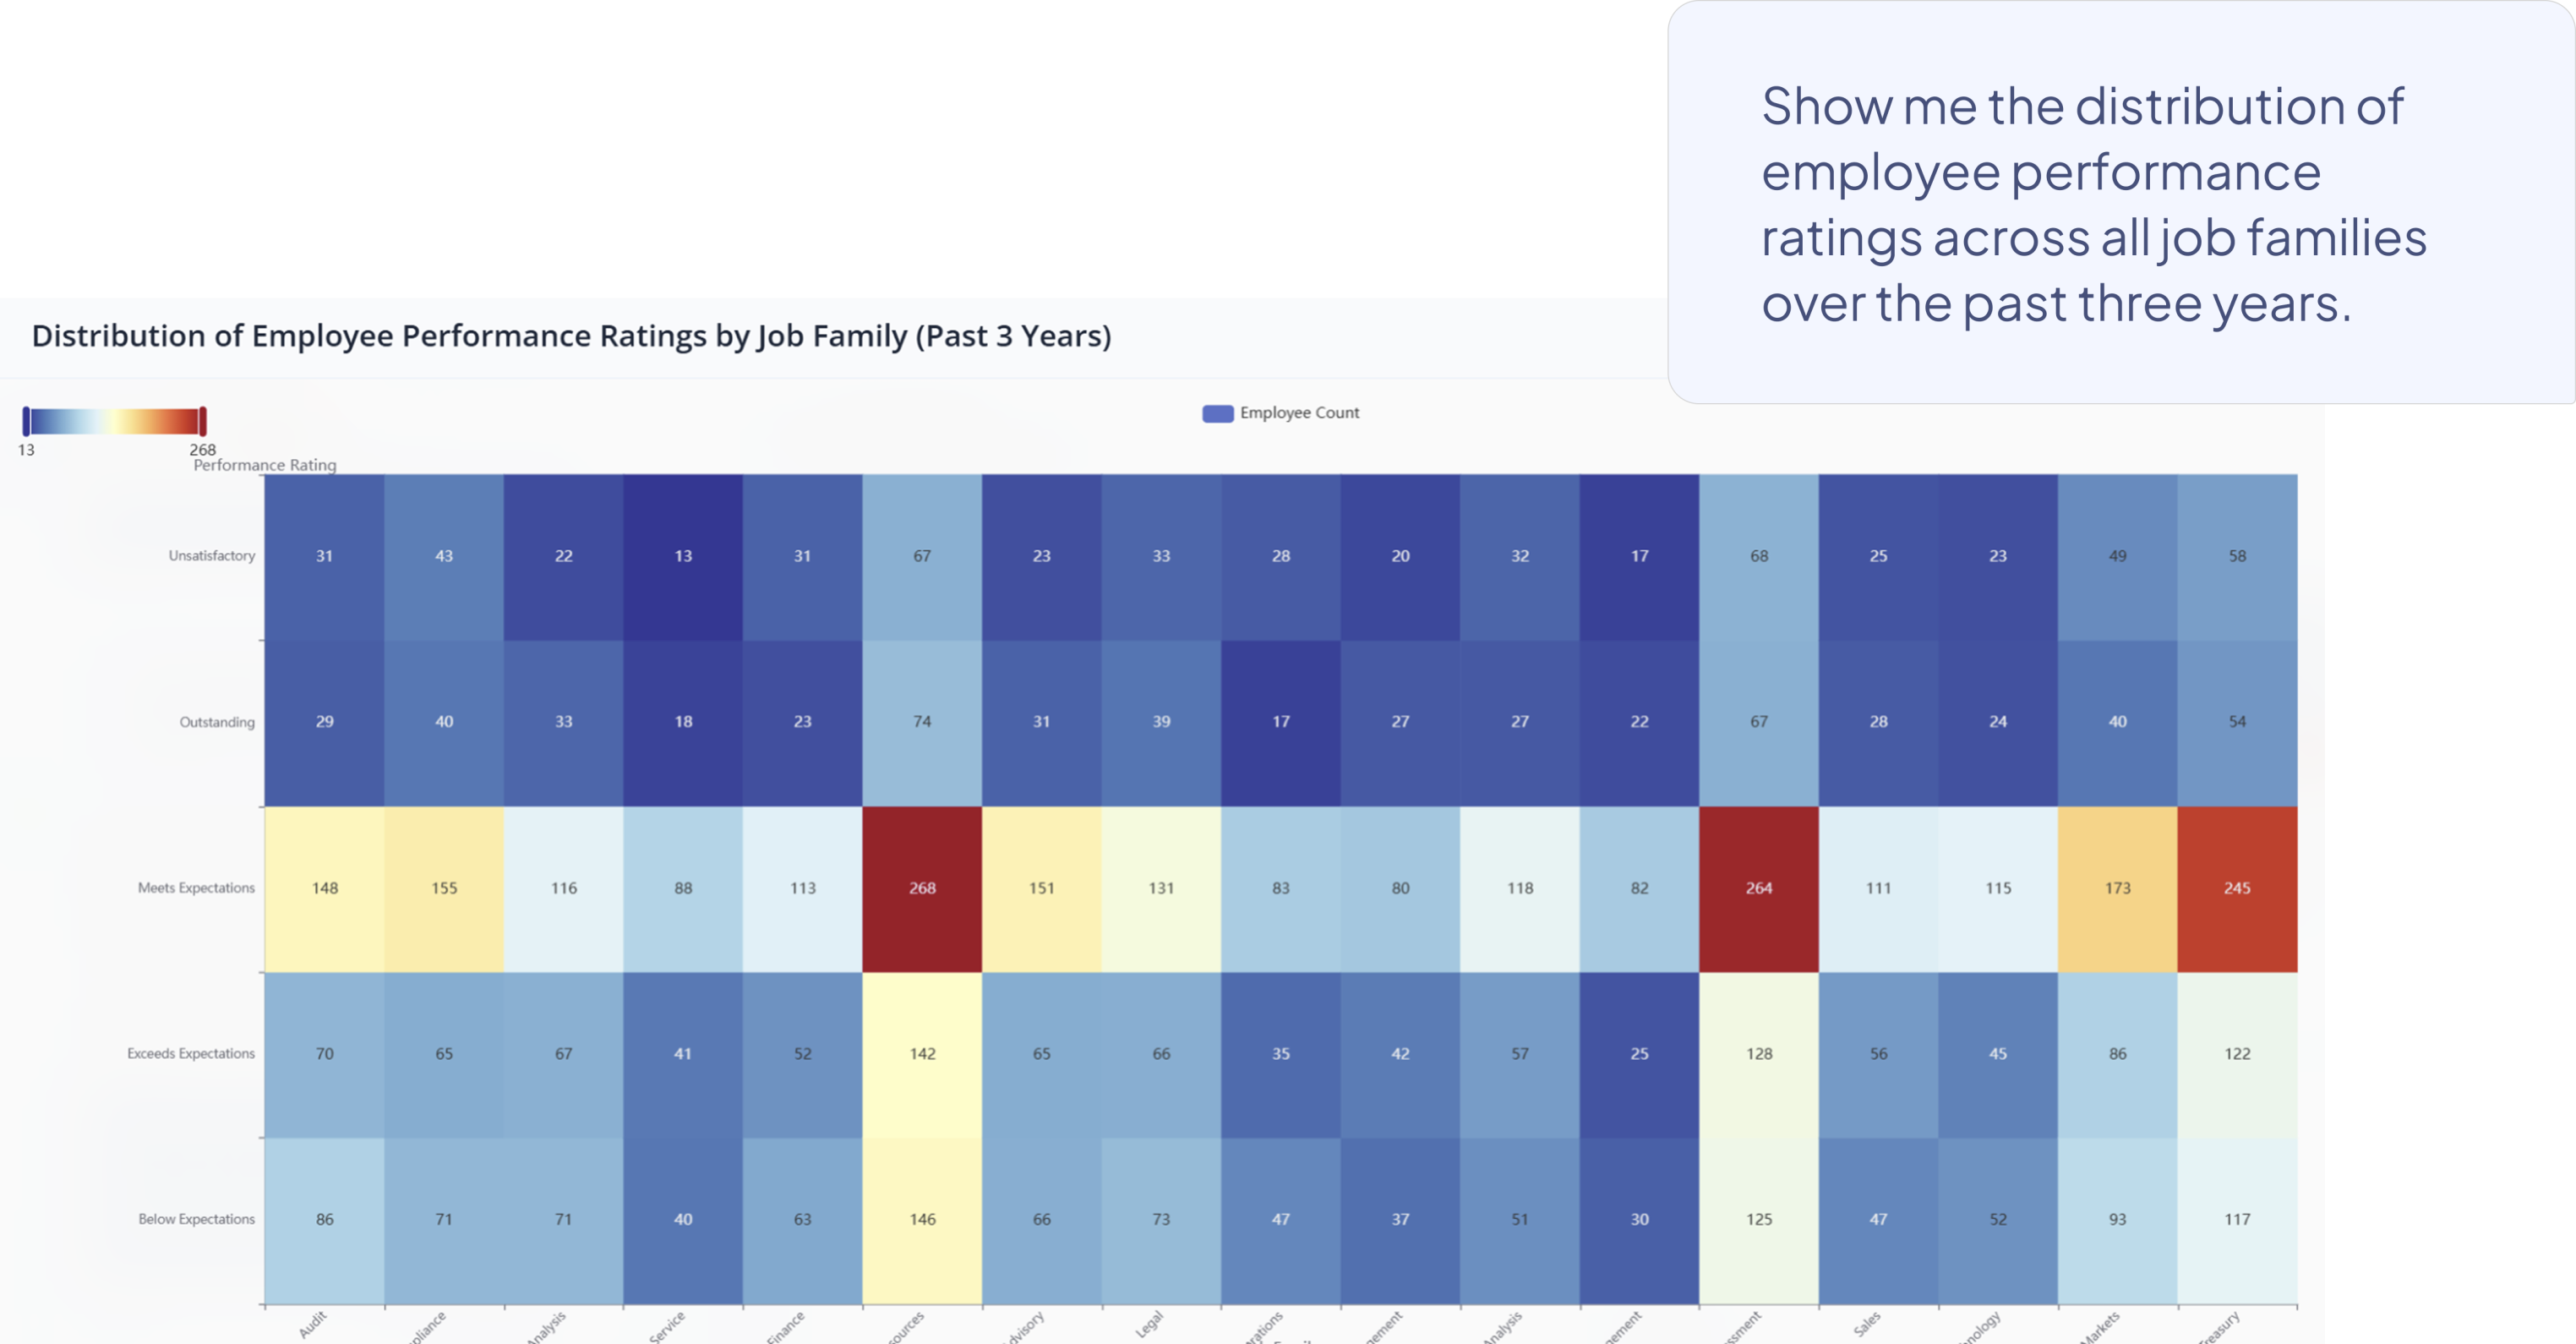
Prompt:
Show me the distribution of employee performance ratings across all job families over the past three years.
Identify the clusters of employees who share similar skill profiles and proficiency levels.
The future of org charting is conversational
We are entering an era where:
- Org charts generate themselves.
- Insights update in real-time.
- Leaders get structural answers without analysts.
- Capabilities and reporting lines merge into unified intelligence.
And it all begins with a simple natural language question.
Decision intelligence platforms that can interpret your data model and render insights instantly are not just helpful; they are becoming foundational to how modern organizations understand themselves.
This capability is already rewriting what operational clarity looks like.
Org charts have been around for more than a century, and they continue to do their job well within their intended purpose: showing hierarchy, reporting lines, and leadership structures. But they are, fundamentally, an old and limited form of visualization. While they provide clarity around formal structure, they fall short when deeper insights, multi-dimensional comparisons, or dynamic organizational behaviors need to be understood.
Modern decision intelligence platforms now offer far more powerful, flexible, and insight-rich visualizations, network graphs, skill maps, flow diagrams, and multidimensional analytics that reveal patterns and relationships an org chart simply cannot capture.
Org charts remain useful, but they are only one lens among many, and relying solely on them means missing the broader story the organization is trying to tell.
And if you’re a leader, analyst, HRBP, or data-driven strategist, Nakisa Decision Intellifence unlocks organizational insights with a level of clarity and immediacy that simply didn’t exist before. You can request a demo of NDI here, or reach out to your dedicated Client Success Manager to access the preview environment.
I often write about AI and Nakisa innovations. Connect with me on LinkedIn for the latest updates!